Segger J-Link GDB with CLion
Scott
Configure CLion to use SEGGER J-Link programmers on Linux, macOS and Windows for flashing and debugging embedded targets including ARM Cortex, RISC-V, and Renesas RX parts.
These instructions are written alongside the current CLion version 2022.2 (at time of writing), checked against 2021.3, and I've been using this approach since CLion 2019.2.
Installing J-Link tools
Download the J-Link tooling for your platform from Segger's downloads page. At time of writing, this was V7.70e.
| Linux | I expanded the J-Link tarball into /opt/segger/jlink-V770e/ |
| macOS | J-Link installer puts the tools in your Applications folder, /Applications/SEGGER/JLink_V770e/. |
| Windows | Default install location is C:\Program Files\SEGGER\JLink\ |
On macOS and Linux, you may decide to manually add this location to your path if you use the other J-Link tools on the CLI - I generally don't as it allows quick changes between multiple versions if needed.
On Windows, the installer either puts it in user PATH automatically, or provides the option to do so during install.
Configuring CLion
Because CLion has had in-built Embedded GDB support since 2019.2, configuration is pretty easy.
-
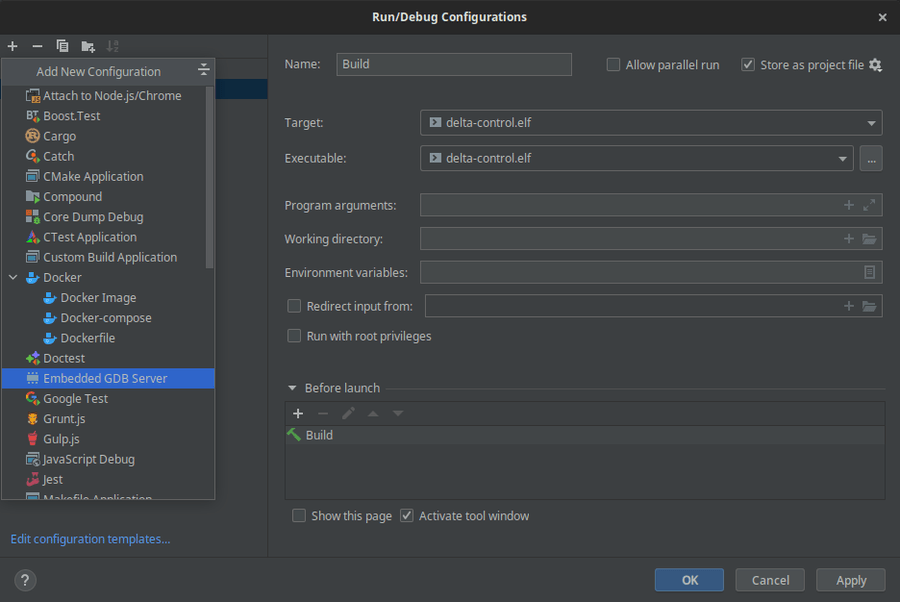
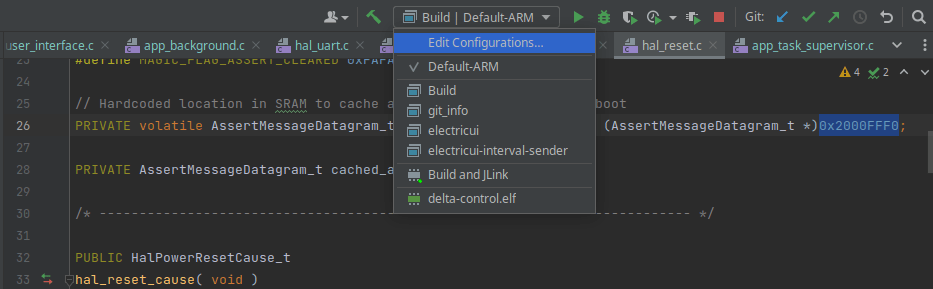
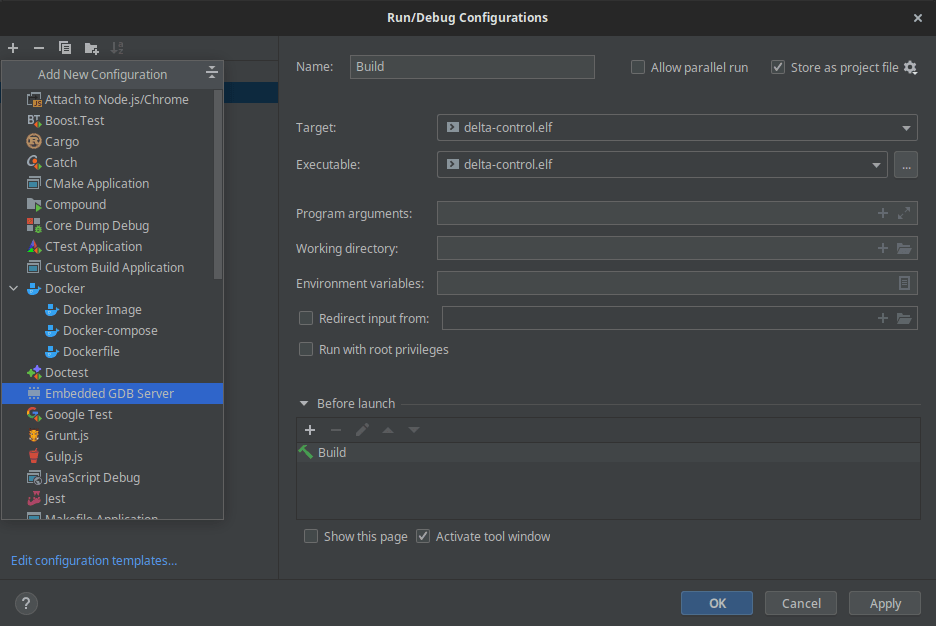
Open the the "Run/Debug Configurations" window, and click the "+" in the top left corner to add a new "Embedded GDB Server" configuration.

-
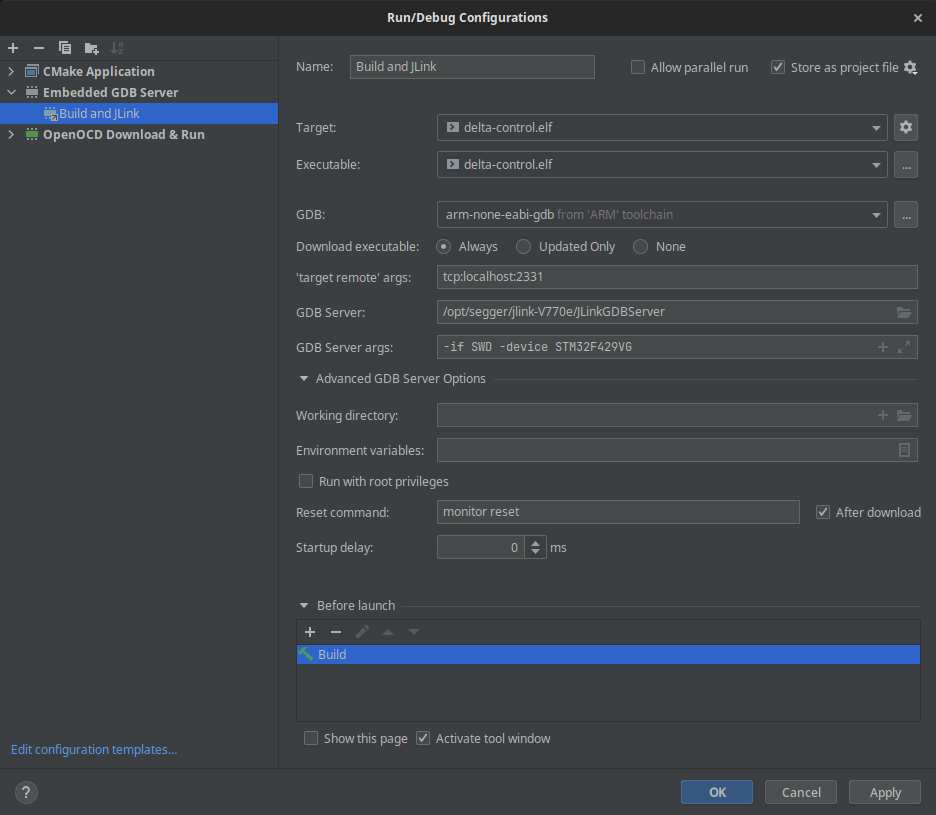
Give it a useful name, I've chosen "Build and JLink", and select your target binary to be flashed.
-
Select the correct GDB toolchain for your platform - I have one configured for
arm-none-eabi-gdbin my toolchain configurations. -
Specify the path and arguments to use to launch
JLinkGDBServer. Example settings in the table and screenshot below (remember to set the appropriate device name as listed in Segger's device table):Field Value Download executable: Always 'target remote' args: tcp:localhost:2331GDB Server: Linux: /opt/segger/jlink-V770e/JLinkGDBServer
macOS:/Applications/SEGGER/JLink_V770e/JLinkGDBServerCLExe
Windows:C:\Program Files\SEGGER\JLink\JLinkGDBServerCL.exeGDB Server args: -if SWD -device STM32F429VGReset command: monitor reset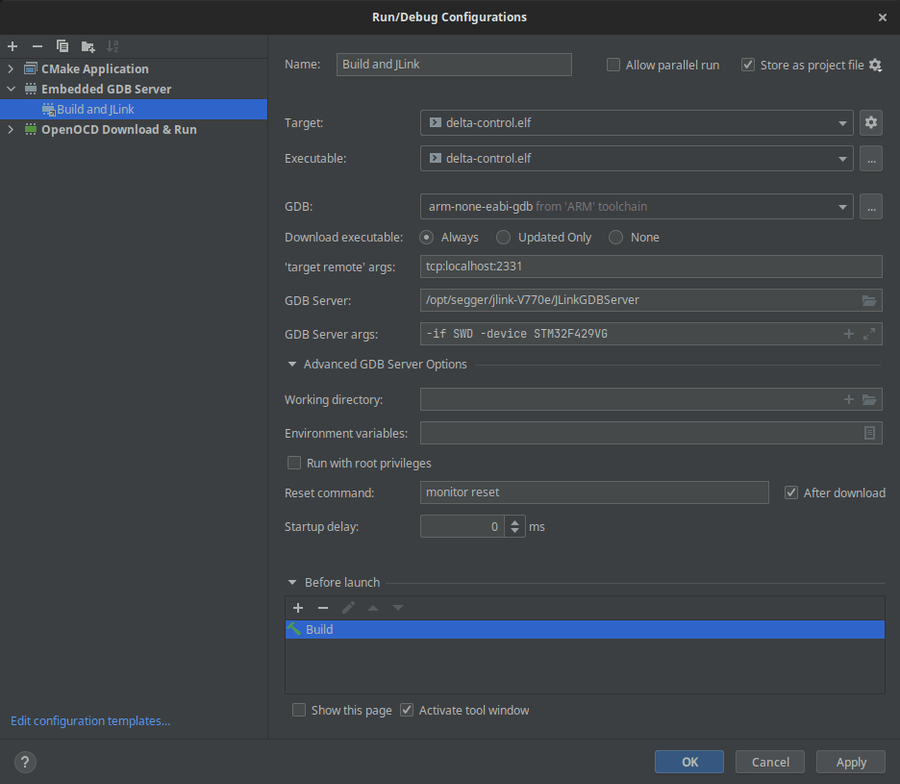
-
If you're like me and prefer a one-click debug workflow - you probably want to ensure 'Build' is added to the "Before launch" box at the bottom to force a rebuild before flashing.
-
Click OK, select the configuration in the top bar, and attempt to flash your target by clicking the green bug icon ("Debug") or use Shift+F9.
-
Your project should build and attempt to flash. If you use one of the EDU JLink probes, then a non-commercial use prompt may be shown prior to flashing.
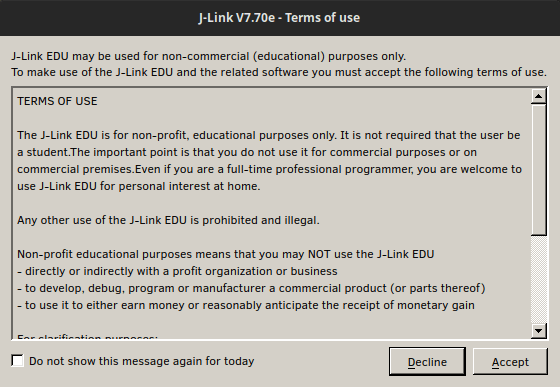
If the prompt appears every time you flash the target after clicking the "Do not show [...]" checkbox:
- launch one of the JLink tools from the CLI and it should stick when invoked from CLion,
- or buy a commercial use model!
-
The binary should be flashed, and code execution should start automatically.
If you've been around the block before and know how debugging works, maybe check out how Electric UI's features can help with higher-level real-time system monitoring. If not, read on for a quick refresher...
Unwanted halt when placing breakpoints?
One of the most frustrating things about working with this combination was the debug probe halting execution when adding or removing a breakpoint.
This often meant I was trying to avoid adding breakpoints during operation which might have affected state, electing to add them later or resorting to retrospective analysis after a deeper halt was triggered.
This is a known issue which I found out by reading comments on an nRF52+CLion blog, as they bundle a JLink probe onboard. One possible solution is:
- Press shift twice to open the search palette,
- Type “registry” (you might need to look in the "Actions" tab),
- Open the Registry, and change the “cidr.debugger.gdb.interrupt.signal” to
SIGTRAP.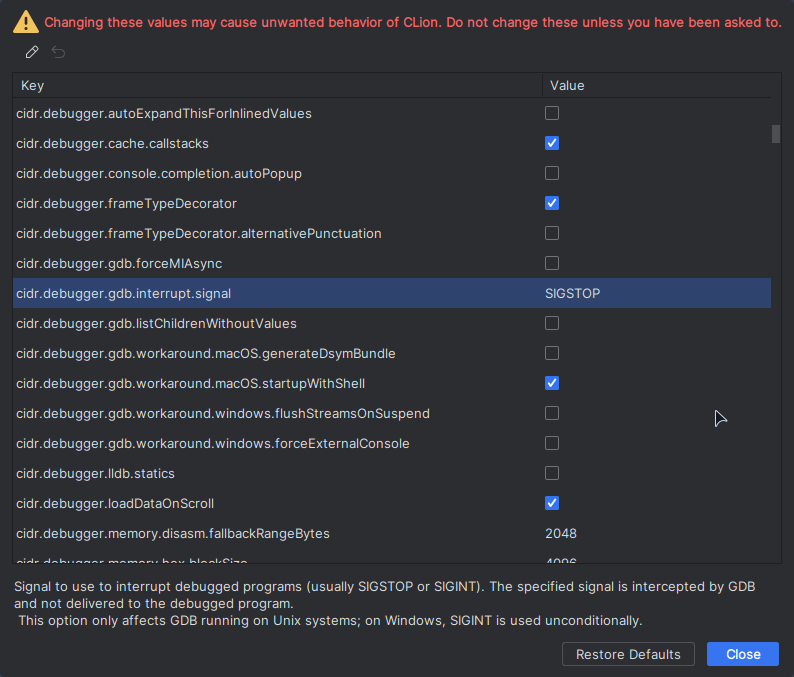
Debugging Basics
Printing to a terminal or log file can only go so far. With the ability to pause code execution at key moments, you'll be able to watch how your variables change and how the microcontroller is executing logic at a speed comfortable for humans.
Bonus features are included because your debug probe has an incredibly deep and invasive access to the microcontroller, allowing you to halt at a specific place or time and then inspect (and even change) variables and memory!
Make sure your code is compiled in Debug mode without optimisations for this next step - once the compiler starts getting clever the debugging can be a bit trickier!
Breakpoints
Click in the left margin next to the line number where you want the debugger to halt.
When the microcontroller hits that line, the debugger will halt the core and allow you to view some internal information, step through code line-by-line, and allow you to resume operation as needed.
When you hit a breakpoint the microcontroller's execution is halted - take a breath, relax, and lets look at some of the basics
-
You can control code execution manually,
- The Green arrow button ▶ resumes code execution until the next breakpoint,
- Use the blue arrow buttons along the top of the Debugger window to step line-by-line, into/out of a conditional, or to wherever your cursor is sitting.

- It's common to set or remove breakpoints while you're in a breakpoint!
-
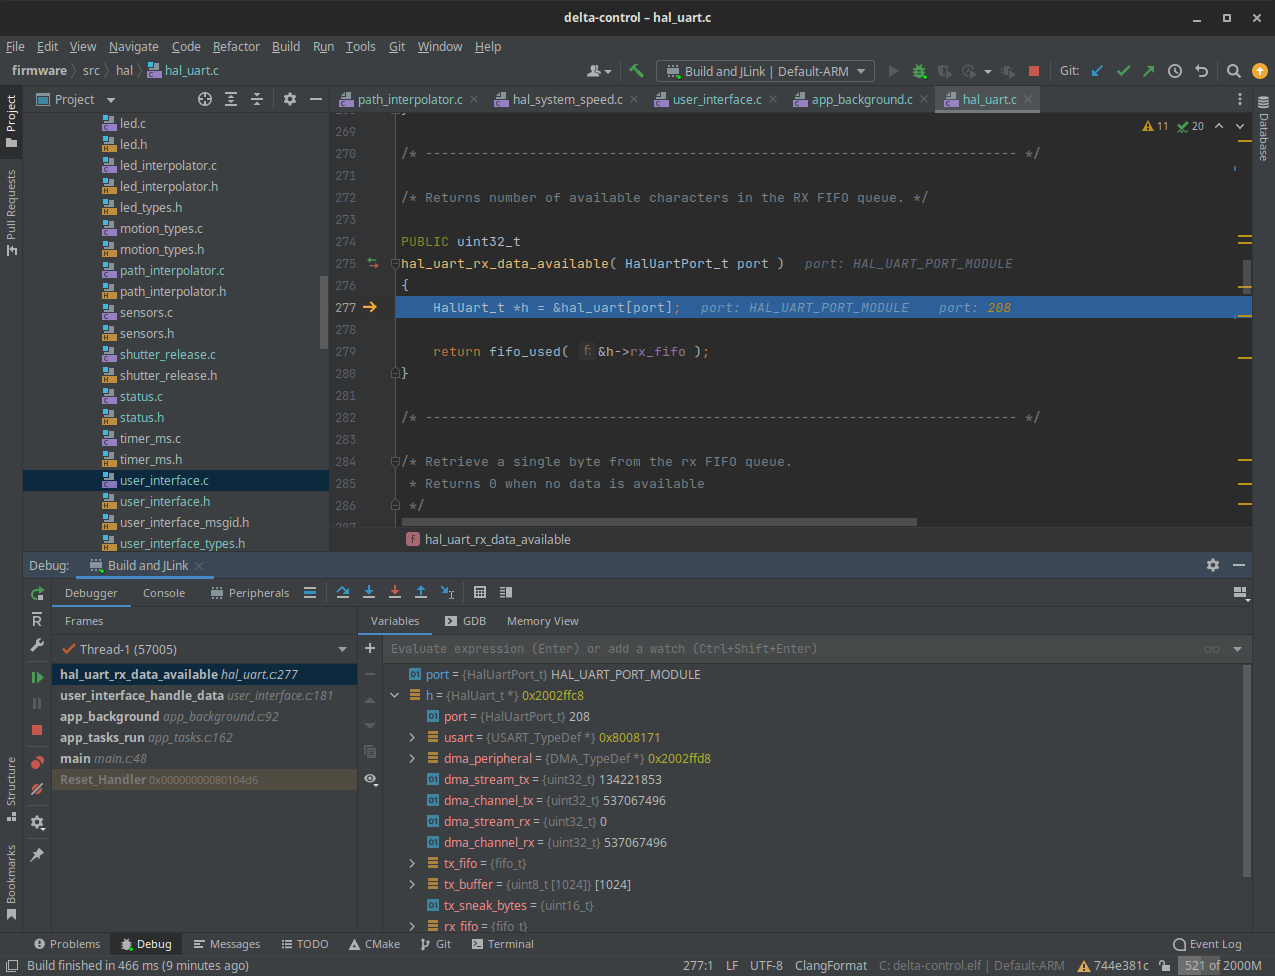
CLion displays function arguments and variables alongside their use in the code view, and you can hover over a variable or pointer to display any relevant information.
-
Relevant data for the current line's scope is shown in the Variables tab in the debug window at the bottom of the screen.
-
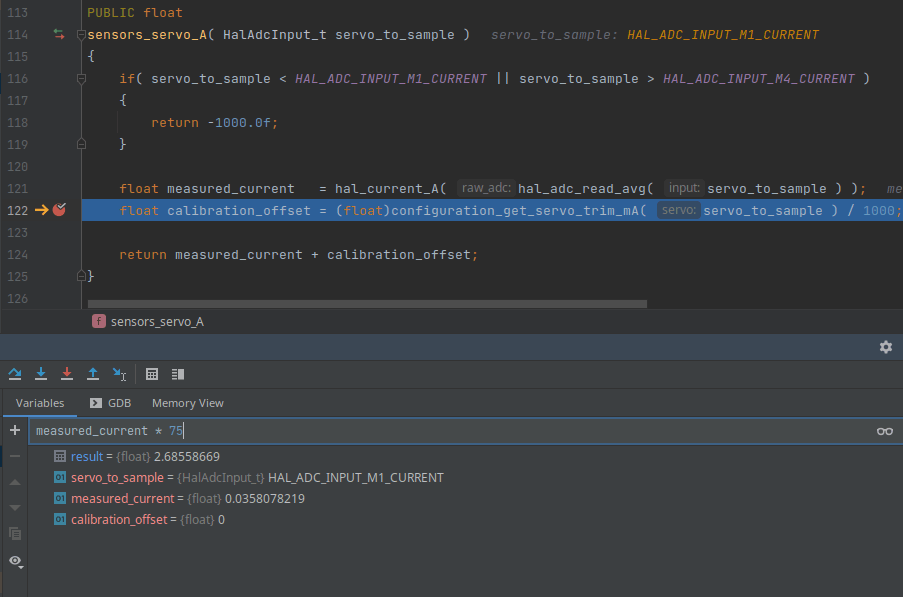
You can pin a specific variable to be displayed in this window by right-clicking on a variable and selecting "Add watch" or by typing the name of the variable into the expressions box.
This is useful for keeping a structure member visible with repeated breakpoints.
-
You can navigate the call-stack on the left hand side of the debugger tab to see what conditions higher level code was in when you hit the breakpoint.
-
You can be naughty and overwrite the value of a variable with "Set Value ..." in the right-click menu (or F2) to manually change specific variables - this can be useful for forcing tricky conditional behaviours to execute!
Depending on how your code was compiled, be aware that this might have unintended consequences!
-
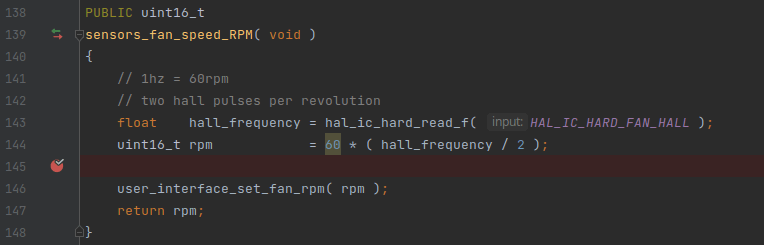
One useful trick is using expressions with variables to improve readability - this could be as simple as converting an ADC reading to a voltage, multiplying current and voltage values for inline power readings, or converting a fixed-point value to a floating-point!
Watchpoints
Instead of triggering on a specific line of code, trigger a break when a specific variable is read and/or written to.
This isn't used as frequently, but can be very useful when debugging data access patterns or infrequent state changes in complex sequences of logic where breakpoints would be unwieldy.
-
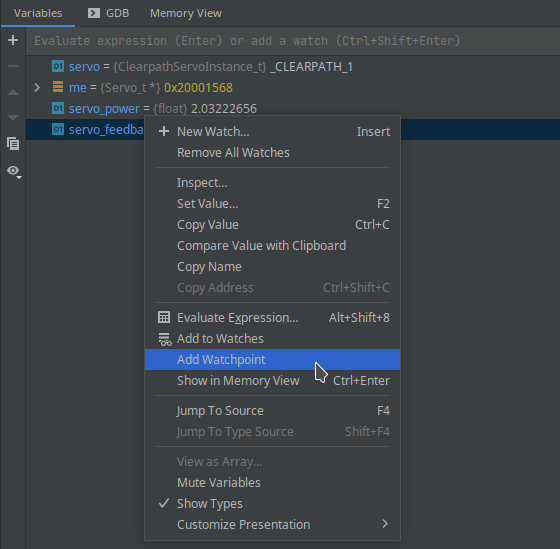
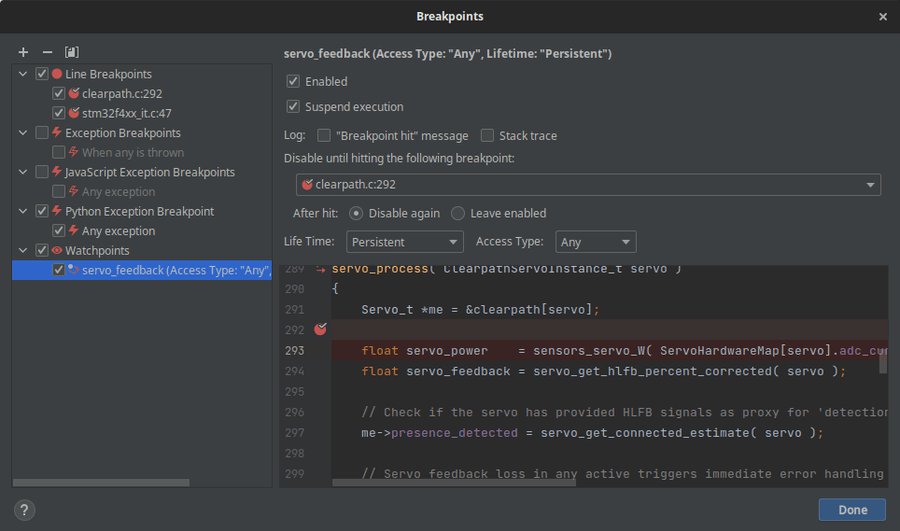
Add a watchpoint in the right-click menu on a variable that's displayed from a breakpoint
-
Choose how the watchpoint should behave, the "Life Time" specifies if the watchpoint is only for this stackframe, or persistent across the application. Access type allows you to filter for read/write data operations.
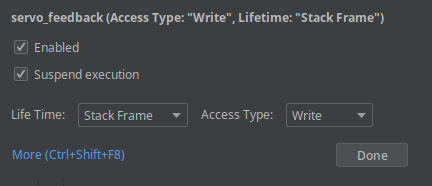
Optional settings can even disable the watchpoint if a specific line of code is hit, or the next time the data is accessed.
-
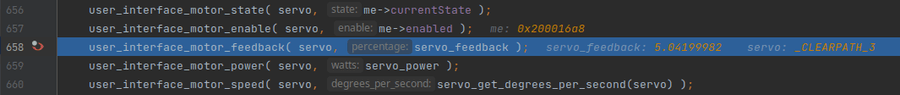
Click run, or continue to step through your code as needed. When our variable is next read/written against we'll get a break like the one shown here


Memory View
When the core is halted, CLion also allows you to view the microcontroller's memory directly with CLion's hex viewer.

For ARM CORTEX parts like that of the STM32F429 used here, the RAM, SRAM flash and peripheral registers are all available in the same linear address range.
These addresses will vary by manufacturer, part, and configuration, so be sure to read the relevant reference manual.
This can be helpful when you:
-
need to check RAM alignment of an array or structure members,
-
are developing a bootloader, or reserve a section of flash for configuration storage, and need to verify what's being written into the right locations,
-
are working with peripherals at a low level alongside the reference manual
-
i.e.
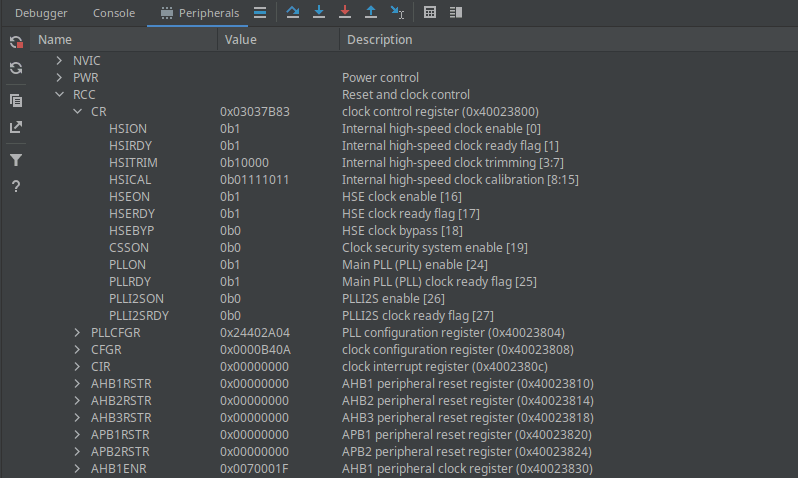
0x40023800on the STM32F429 corresponds to RCC peripheral responsible for clock configuration.The Peripherals viewer provides far better experience if you have a
.svdfile!
-
Peripheral View with SVD
For most ARM microcontrollers, a System View Description format (CMSIS-SVD) file should be available which describes the memory-mapped peripherals for your microcontroller.
A good collection of files for wide range of microcontrollers can be downloaded from Paul Osborne's GitHub repository (3rd party).
If you've successfully downloaded the matching .svd file for your microcontroller, clicking the "Peripherals" tab during a debugging session will allow you to load the file and view the core's peripherals with a more readable tree interface than the HEX viewer.