ChartAxis
Render axis frames, ticks and labels on a ChartContainer.
Usage
Import the component and include it inside a ChartContainer to enable the axis frame and gridlines with automatic tick settings.
HorizontalAxis represents the x-axis of the chart, or for streaming line charts using RealTimeDomain we use TimeAxis. VerticalAxis is the y-axis.
The two axis components can operate standalone or together, and both share the same configuration properties.
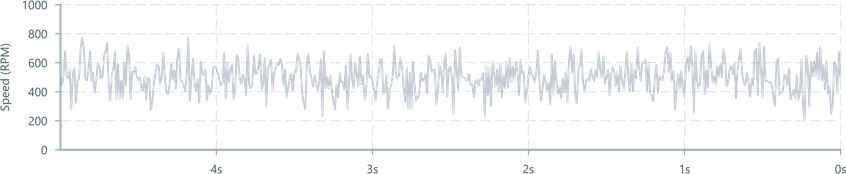
import { ChartContainer , LineChart , RealTimeDomain , TimeAxis , VerticalAxis ,} from '@electricui/components-desktop-charts'import { useMessageDataSource } from '@electricui/core-timeseries' const OverviewPage = () => { const signalDataSource = useMessageDataSource ('speed') return ( <React .Fragment > <ChartContainer > <LineChart dataSource ={signalDataSource } /> <RealTimeDomain window ={10000} /> <TimeAxis /> <VerticalAxis /> </ChartContainer > </React .Fragment > )}Labels
Configure axis labels by passing the label property a string.
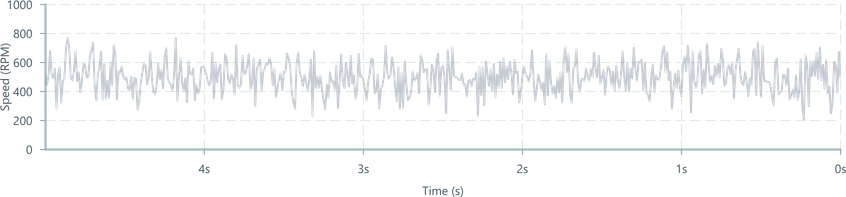
<TimeAxis label ="Time (s)" /><VerticalAxis label ="Speed (RPM)" />The labelPadding property is available on both axis, specifying the spacing between the labels and the chart.
<TimeAxis label ="Time (s)" labelPadding ={30} />Tick Quantity
Pass tickCount a positive number to override the number of ticks drawn on the axis frame.
This value is approximate - it prioritises evenly spaced and 'round' numbered ticks over strict adherence to the count.
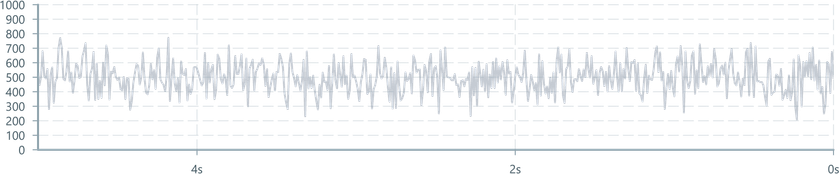
<TimeAxis tickCount ={2} /><VerticalAxis tickCount ={8} />Tick Values
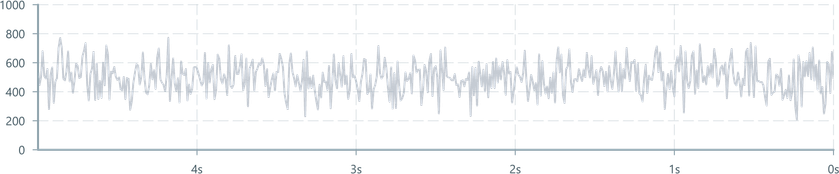
Pass tickValues an array of numbers to manually specify the tick render behaviour.
This can be useful where varying densities of grid-lines and axis ticks improve readability.
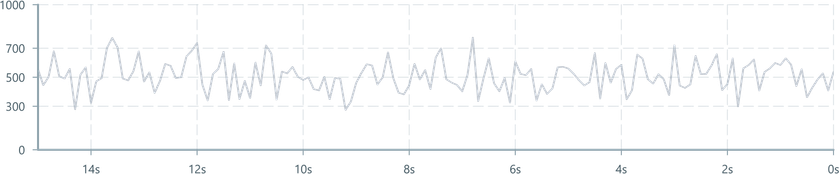
<VerticalAxis tickValues ={[0, 300, 500, 700, 1000]} />
tickValuesis not available on theTimeAxiscomponent.
Custom Tick Formatting
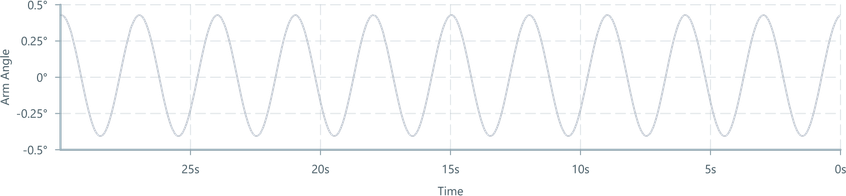
Format ticks by passing a the tickFormat prop a styling function.
Commonly used for adding symbols like degrees °, or changing the text from the raw value 10000 to a more readable string such as 10k.
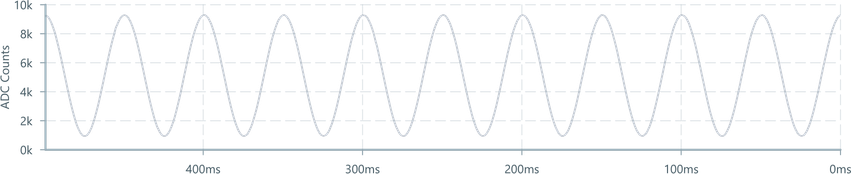
It passes the current tick, the index of the tick, and the entire array of ticks as arguments and expects a string or number as a return value.
<VerticalAxis tickFormat ={(tick : number, index : number, ticks : number[]) => `${tick / 1000}k` } label ="ADC Counts"/>A common distinction for formatting occurs when allowing user-selectable Zoom levels.
When this occurs, absolute time is used and alternative formatting controls are available with
tickFormatAbsolute
Specifying data ranges
By default, the chart will autoscale the y-axis based on the range of visible data. To constrain the bounds, use the yMin and yMax properties of the domain component of the chart. While the axis component provides the visual tick marks, the domain component controls the actual bounds of data.
TimeAxis alignment
The TimeAxis has the 0 aligned to the right by default. That alignment can be changed via the align prop to the left, right or center. By default values don't display a negative sign, but if this behaviour is undesirable, it can be disabled by setting the allowNegative prop.
This chart has its time axis aligned to the right, no allowNegative, this is the default:
<TimeAxis align ="right" />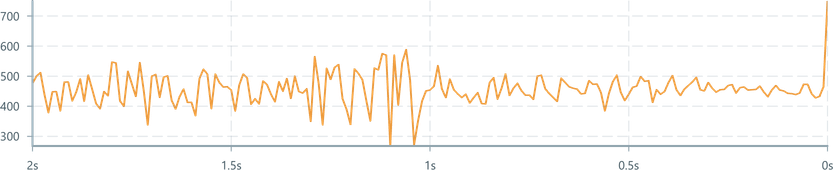
Aligned to the right, with allowNegative:
<TimeAxis align ="right" allowNegative />
Aligned to the left: (allowNegative has no effect here since the origin is on the left)
<TimeAxis align ="left" />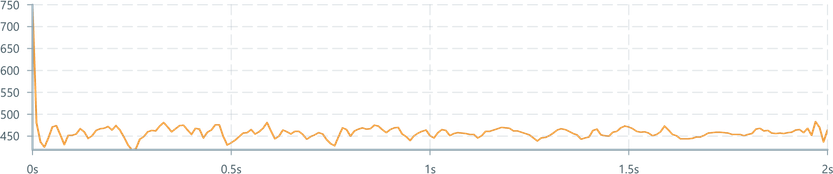
Center aligned, no allowNegative:
<TimeAxis align ="center" />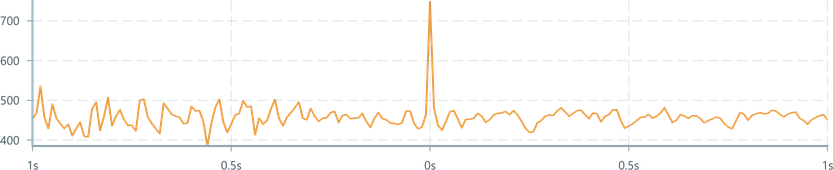
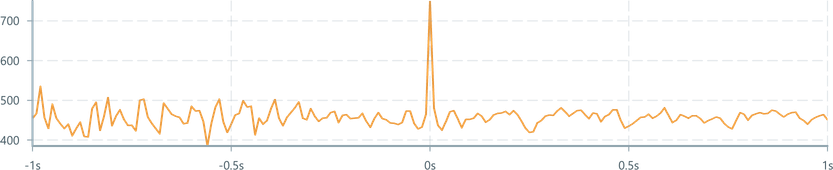
Center aligned, with allowNegative:
<TimeAxis align ="center" allowNegative />