TimeSlicedLineChart
Plot two datasources against each other for 2D charts.
Usage
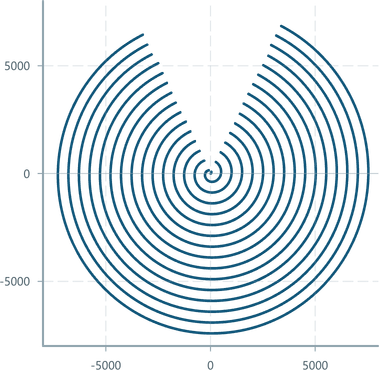
In situations where the signal's property needs to be plotted in relation to another variable, a 2D chart might make more sense than a LineChart.
Instead of using a normal LineChart and RealTimeDomain, we provide a TimeSlicedLineChart and RealTimeSlicingDomain which are designed to process and render data on the x and y axis simultaneously.
Both variables need to be in the same DataSource. Refer to the DataSource guide to combine different messages.
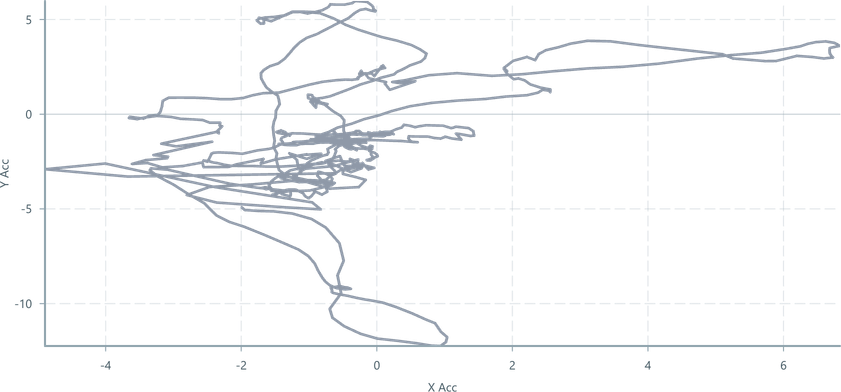
import { ChartContainer , TimeSlicedLineChart , RealTimeSlicingDomain , VerticalAxis , HorizontalAxis , } from '@electricui/components-desktop-charts'import { useMessageDataSource } from '@electricui/core-timeseries' const OverviewPage = () => { const accelDS = useMessageDataSource ('accelerometer') return ( <React .Fragment > <ChartContainer > <TimeSlicedLineChart dataSource ={accelDS } accessor ={(data , time ) => ({x : data .acc_x ,y : data .acc_y })} /> <RealTimeSlicingDomain window ={1000} /> <VerticalAxis /> <HorizontalAxis /> </ChartContainer > </React .Fragment > )}Formatting
The full set of LineChart supported formatting controls are still available with a TimeSlicedLinechart:
lineWidthcolorandcolorAccessordashedwithdashScale,dashSize,dashOffset,dashGapSizeopacityandopacityAccessor,opacitySource
Fog
Chart readability improves when less data is 'stored' onscreen, especially when used with noisy sensor data.
By specifying a Fog component, older data fades out. This is achieved under the hood by configuring a shader based on the near and far planes of the ChartContainer orthographic camera.
import { Fog } from '@electricui/components-desktop-charts' <Fog color ="#fff" />Continuity
By default, connection acceptability (boolean) is used to create gaps in the TimeSlicedLineChart. This is a more accurate representation of the data.
To manually control continuity behaviour, the continuitySource prop accepts a Datasource of boolean type where a true describes a break in continuity, and false describes a return to continuity.
A 'hole' will be inserted at the time of the break, and no data will be drawn until continuity is restored.
<TimeSlicedLineChart dataSource ={accelDS } accessor ={(data , time ) => ({x : data .acc_x ,y : data .acc_y })} continuitySource ={imuHealthDS }/>To opt-out of default continuity behaviour, pass null
<TimeSlicedLineChart dataSource ={accelDS } accessor ={(data , time ) => ({x : data .acc_x ,y : data .acc_y })} continuitySource ={null}/>continuityAccessor allows typical accessor syntax to use members of a structure as the flag.
Blanking
The blankingTrigger property accepts a DataSource. Any Event on this DataSource will wipe the internal store of data, resulting in a blank/empty line.
This can be used clear previous results in longer running test-bench usecases, or can be rapidly invoked to provide oscilloscope style redraw behaviour.
Accessor usage is not currenty supported.
Batch Ingestion
The batch ingestion API can be used to ingest an array of points stored in a single event. It is an advanced API that also allows for full chart blanking and the injection of continuity breaks during event processing.
When the API is used, the
accessorandcolorAccessorAPIs are both disabled.The
continuitySource,continuityAccessor, andblankTriggerAPIs may still be used.
The default continuity source will both inject continuity breaks and halt ingestion of events (including into this batch API) unless explicitly disabled. Similarly the blankTrigger will continue to blank the chart.
The batchIngestion API calls the provided function with the arguments: (data: T, time: number, api: BatchAPI, helpers: BatchAPIHelpers) per event.
The api argument contains three properties:
ingesttakesx, y, z, r?, g?, b?arguments and adds a point to the line. If the RGB information is not supplied, the default color will be used. The helper object contains astaticColorAPI described below.addContinuityBreakinserts a gap between any previous or future points on the line. It does not halt data ingestion.blankwipes all data currently held in the chart.
The helpers object contains a staticColor helper that can be used as a preallocated scratch space for working with colors.
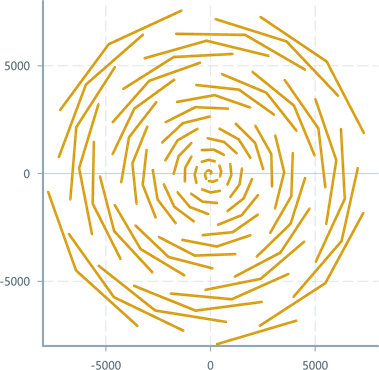
import { Colors } from '@blueprintjs/core'import { ChartContainer , TimeSlicedLineChart , RealTimeSlicingDomain , VerticalAxis , HorizontalAxis , } from '@electricui/components-desktop-charts'import { useMessageDataSource } from '@electricui/core-timeseries' const OverviewPage = () => { const circleData = useMessageDataSource <{x : number; y : number}[]>('circle') return ( <React .Fragment > <ChartContainer > <TimeSlicedLineChart dataSource ={circleData } continuitySource ={null} // optionally disable the default continuity source lineWidth ={3} color ={Colors .GOLD3 } batchIngestion ={(data , time , tags , ingest , blank , staticColor ) => { blank () staticColor .set (Colors .GOLD3 ) for (let index = 1; index < data .length ; index ++) { const prev = data [index ] const curr = data [index ] // Inject a hole after every 3 points by skipping an insertion if (index % 3 === 0) { continue } ingest ( prev .x , prev .y , curr .x , curr .y , staticColor .r , staticColor .g , staticColor .b , 1, staticColor .r , staticColor .g , staticColor .b , 1, ) } }} /> <RealTimeSlicingDomain window ={1000} xMin ={-8000} xMax ={8000} yMin ={-8000} yMax ={8000} /> <VerticalAxis /> <HorizontalAxis /> </ChartContainer > </React .Fragment > )}