TriggerDomain
TriggerDomain provides an on-demand time-series reference for charts based on an external trigger datasource.
Usage
TriggerDomain has a similar API surface to a RealtimeDomain, but provides one-shot timing domains rather than a rolling reference.
This is used alongside a LineChart or TimeSlicedLineChart to create a oscilloscope style chart which only draws when a trigger event occurs.
Triggers are provided via datasource, either from a separate triggering message, or by creating a custom datasource which fires events when some condition has been met.
This example snippet fires a trigger event when the spl message value exceeds 90. When this occurs, the LineChart will render the specified 1000ms window of data in relation to the trigger timestamp.
import { ChartContainer , LineChart , TriggerDomain , HorizontalAxis , VerticalAxis ,} from '@electricui/components-desktop-charts'import { useMessageDataSource } from '@electricui/core-timeseries'import { useDataTransformer } from '@electricui/timeseries-react'import { filter } from '@electricui/dataflow' const soundDS = useMessageDataSource <number>('spl') const triggerDS = useDataTransformer (() => { const triggerMax = 90 const eventsAboveThreshold = filter (soundDS , (data , time ) => { return data > triggerMax }) return eventsAboveThreshold }) const OverviewPage = () => { return ( <React .Fragment > <ChartContainer > <LineChart dataSource ={soundDS } /> <TriggerDomain window ={1000} dataSource ={triggerDS } accessor ={(event , time ) => time } /> <HorizontalAxis /> <VerticalAxis /> </ChartContainer > </React .Fragment > )}Notice how the TriggerDomain uses accessor syntax to select the time value in the Event? This is because the trigger source doesn't care about the payload of the event, only the time at which it was generated. This accessor behaviour is the default.
It is possible to use timestamps in structured messages (done at a codec level), and use the same datasource for linecharts and TriggerDomain by writing an accessor which grabs the relevant timestamp from the event's structure i.e. accessor={(event, time) => event.custom_timestamp}.
Trigger alignment
By default, the chart will align the trigger time to the right hand side of the chart. This can be changed to the left or center with the align prop. By setting a similar prop on the TimeAxis, the times will line up.
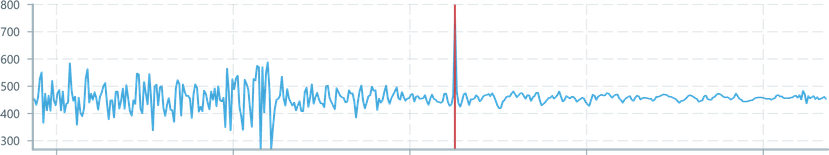
For example this chart contains all the data:
This chart has a trigger domain aligned to the left:
<TriggerDomain dataSource ={triggerDS } window ={2000} align ="left"/><TimeAxis align ="left"/>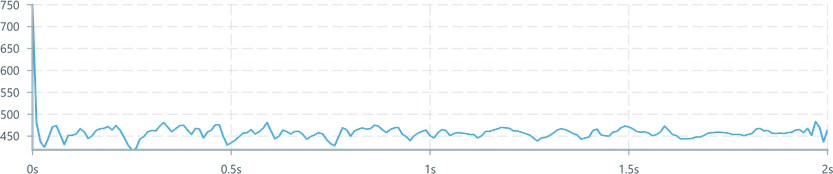
Aligned to the right:
<TriggerDomain dataSource ={triggerDS } window ={2000} align ="right"/><TimeAxis align ="right"/>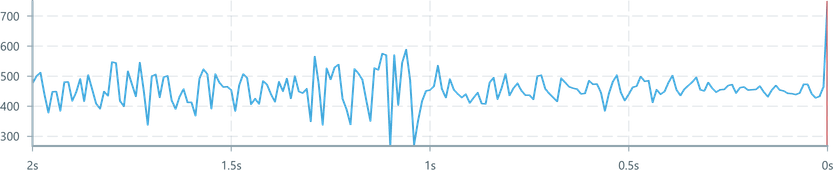
Center aligned:
<TriggerDomain dataSource ={triggerDS } window ={2000} align ="center"/><TimeAxis align ="center" allowNegative />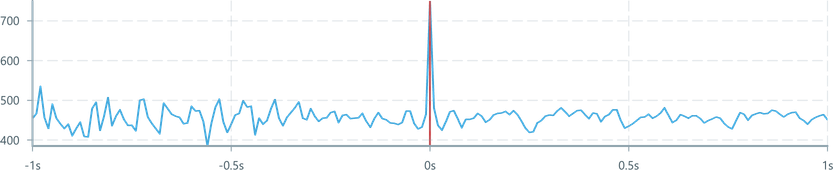
The allowNegative prop on the TimeAxis displays time to the left of the origin with a negative sign.
Specifying data ranges
By default, the chart will autoscale the y-axis based on the range of visible data. This ranging calculation is performed here, because the TriggerDomain is ultimately responsible for processing and managing the data.
Constrain either the minimum, maximum, or both bounds in the y-axis by providing yMin and/or yMax values as numbers. If this domain is known, it is recommended to constrain it as a performance optimisation.
Soft constraints can be added to provide a minimum extent with the yMinSoft, and yMaxSoft properties. If the data exceeds the soft constraint, the chart will autoscale. If the data does not exceed the soft constraint, the soft constraint is used as the domain.
<TriggerDomain dataSource ={triggerDS } window ={1000} yMin ={0} yMax ={100}/>