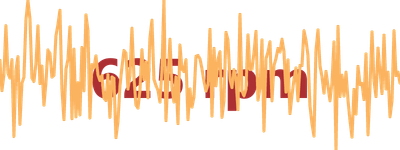
Sparkline Chart Example
Sparklines are often used as simple displays of trends where a full graph isn't required.
CSS Approach
Position an overlapping pair of div to position a Printer over a LineChart.

<div style={{ position: 'relative', height: '150px', width: '400px' }}> <div style={{ width: '100%', height: '100%', position: 'absolute', top: 0, left: 0, zIndex: -1, }} > <ChartContainer height="100%" width="100%"> <LineChart dataSource={dataSource} color={Colors.ORANGE5} /> <RealTimeDomain window={10000}/> </ChartContainer> </div> <div style={{ position: "relative", top: "50%", transform: "translateY(-50%)", textAlign: 'center', color: `${Colors.RED2}`, fontSize: '4em', fontWeight: "bold" }} > <Printer accessor="rpm" precision={0} /> rpm </div></div>