Debugging the UI
An important aspect part of developing complex software is good tooling to aid in debugging and take guesswork out of development.
Developer Tools
The Developer Tools automatically open with the development environment, and provide console output, performance profiling and debugger support for the frontend of your application.
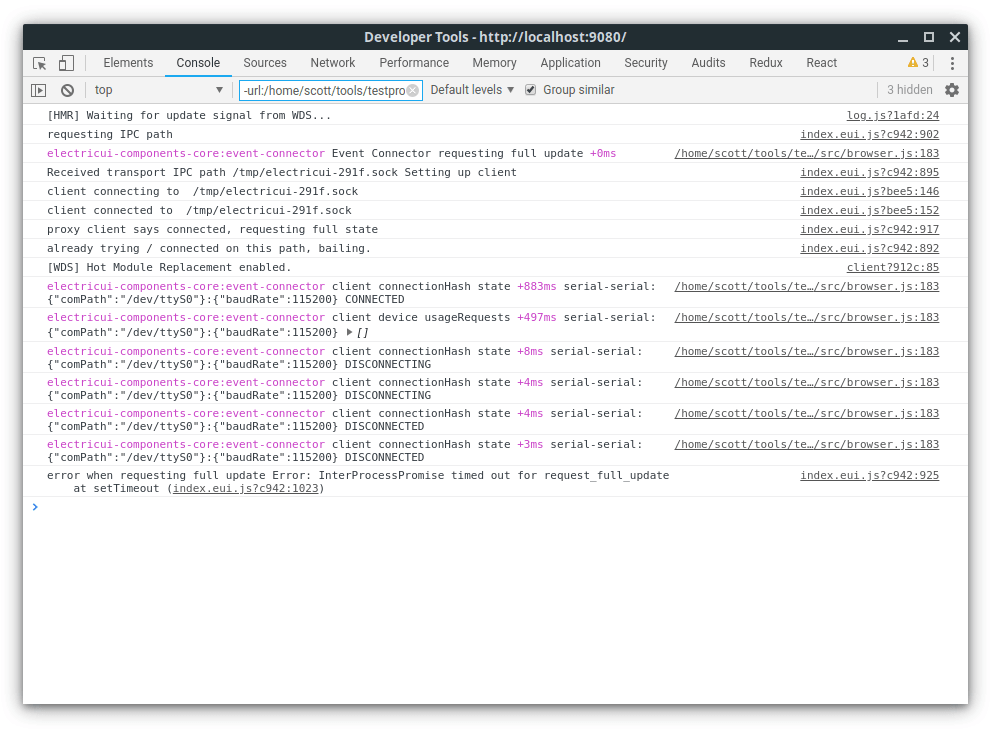
In development mode under the File menu, the "Show transport window" button which will open tooling for the transport-manager, responsible for everything to do with hardware interaction. The developer tooling is similar, but provides configurable levels of debug console output for transport and connections libraries.
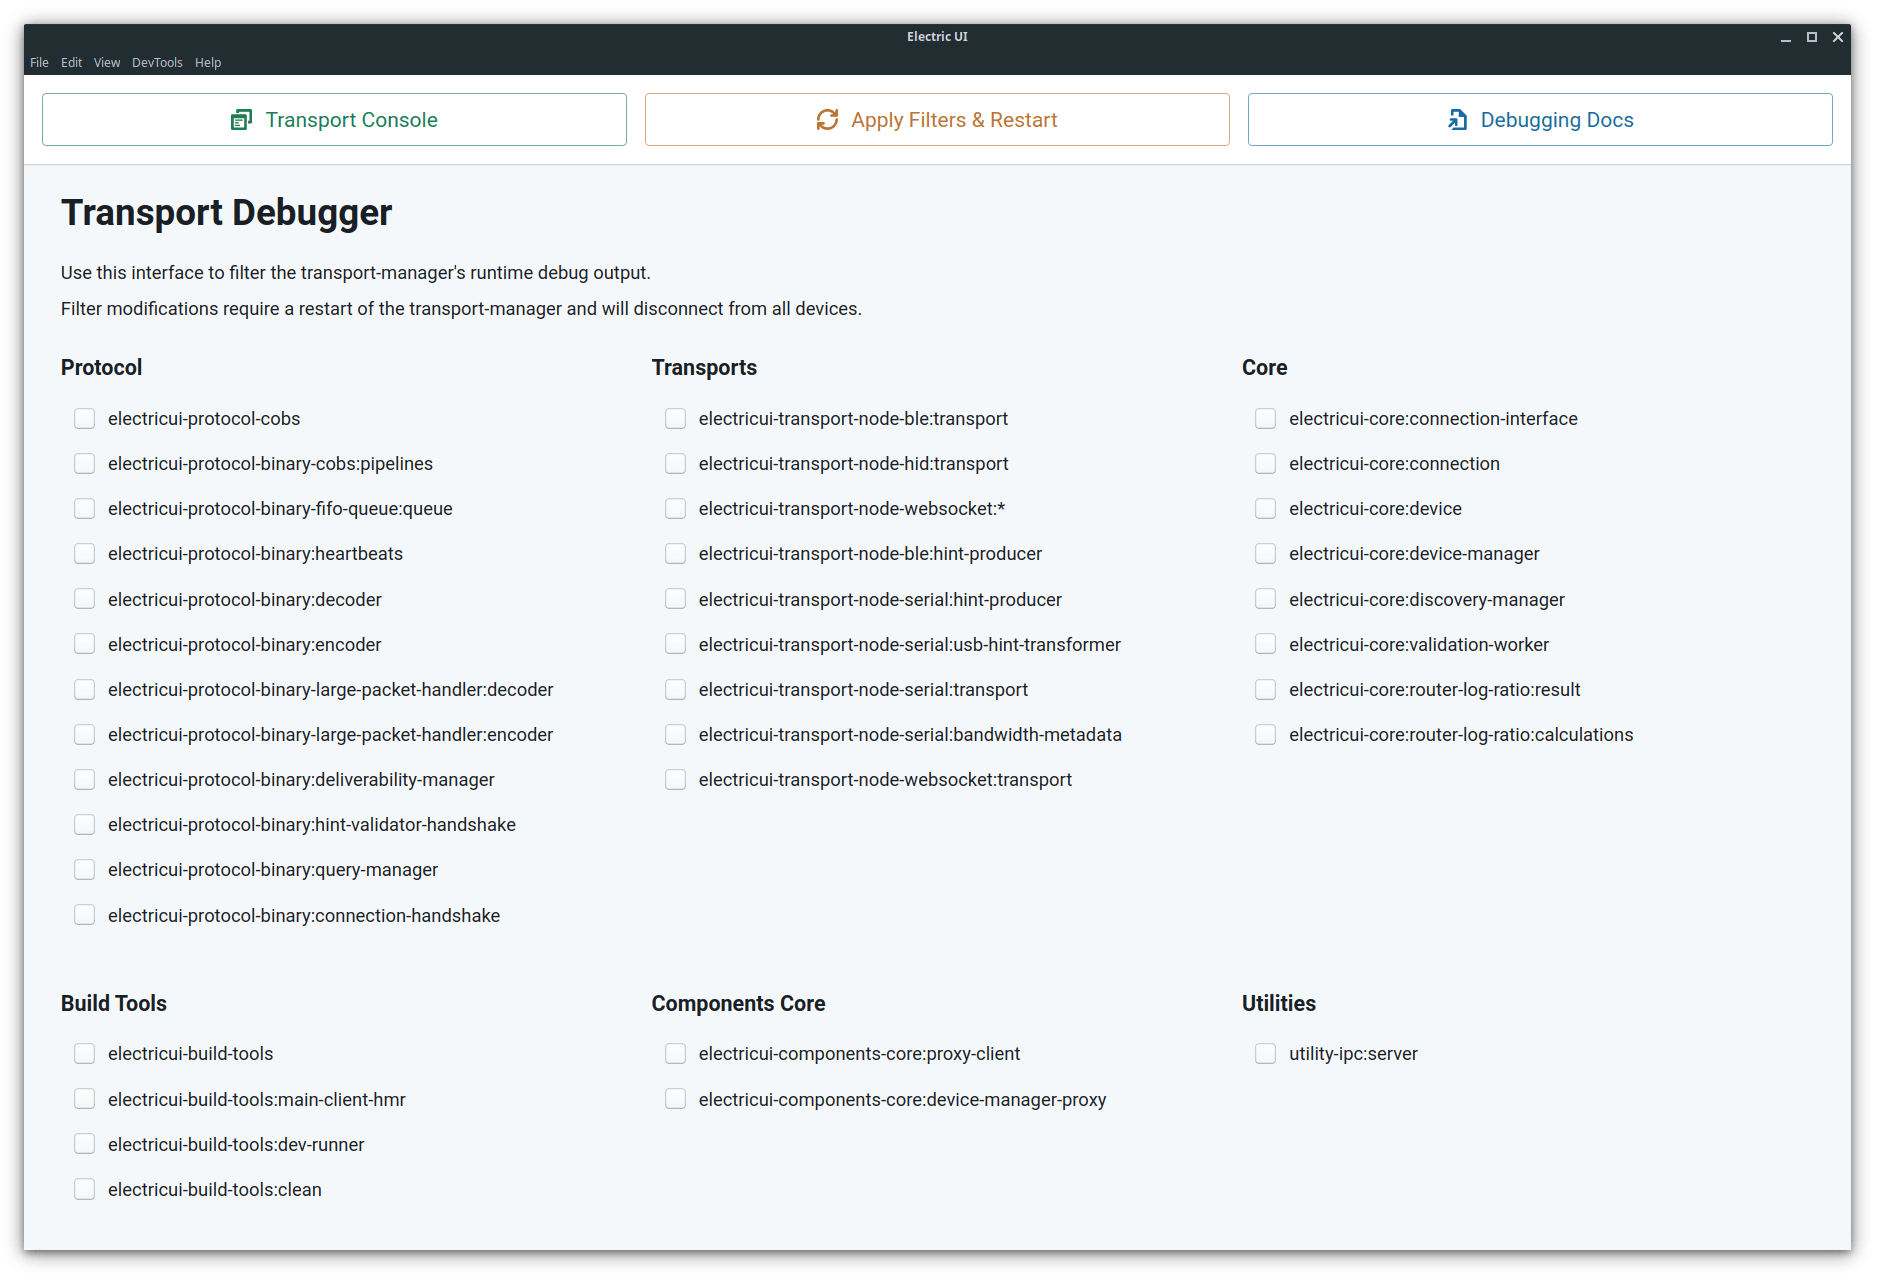
Changing the transport-manager debug level requires a full-reload of the application. This happens automatically, but you will lose UI state.
Debugging with Breakpoints
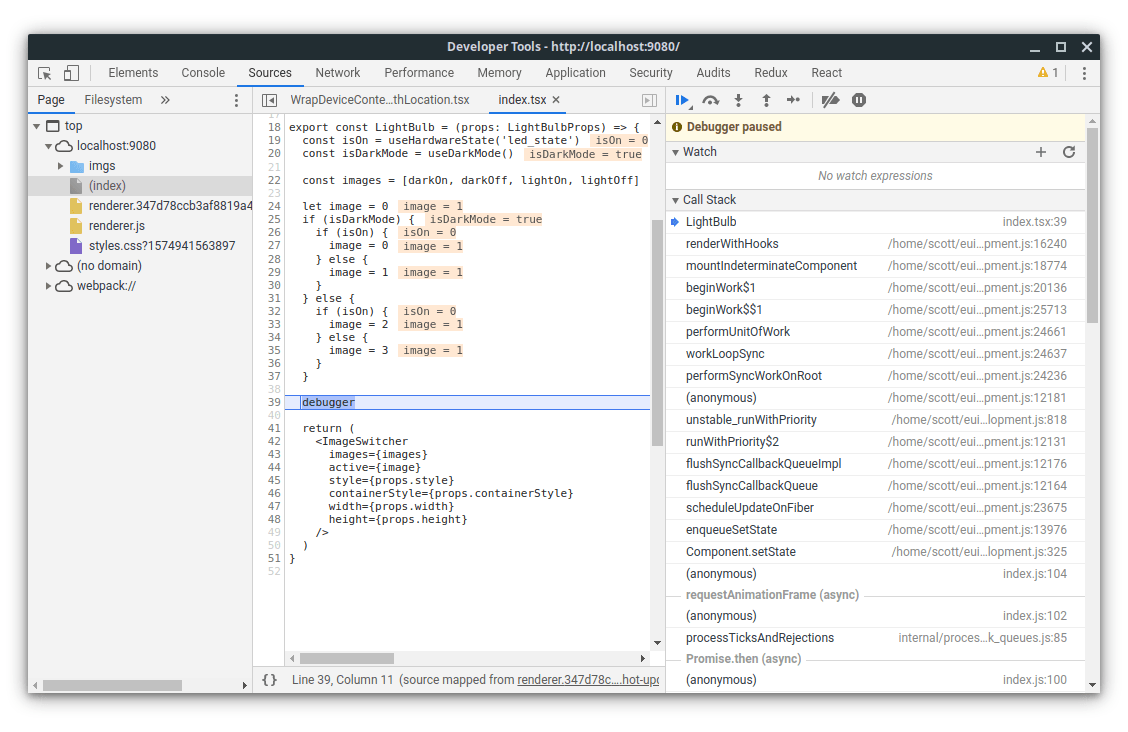
Breakpointing with line-by-line step-through is a staple of serious debugging workflows.
To trigger a breakpoint, in your Typescript code insert the debugger keyword.
export const LightBulb = (props: LightBulbProps) => { const isDarkMode = useDarkMode() // application stuff debugger return ( <ImageSwitcher ... /> )}When hit, the console will pause execution and provide a stacktrace, display variable values, and (top right buttons) allows stepping through code line-by-line, by-function or just to resume execution.
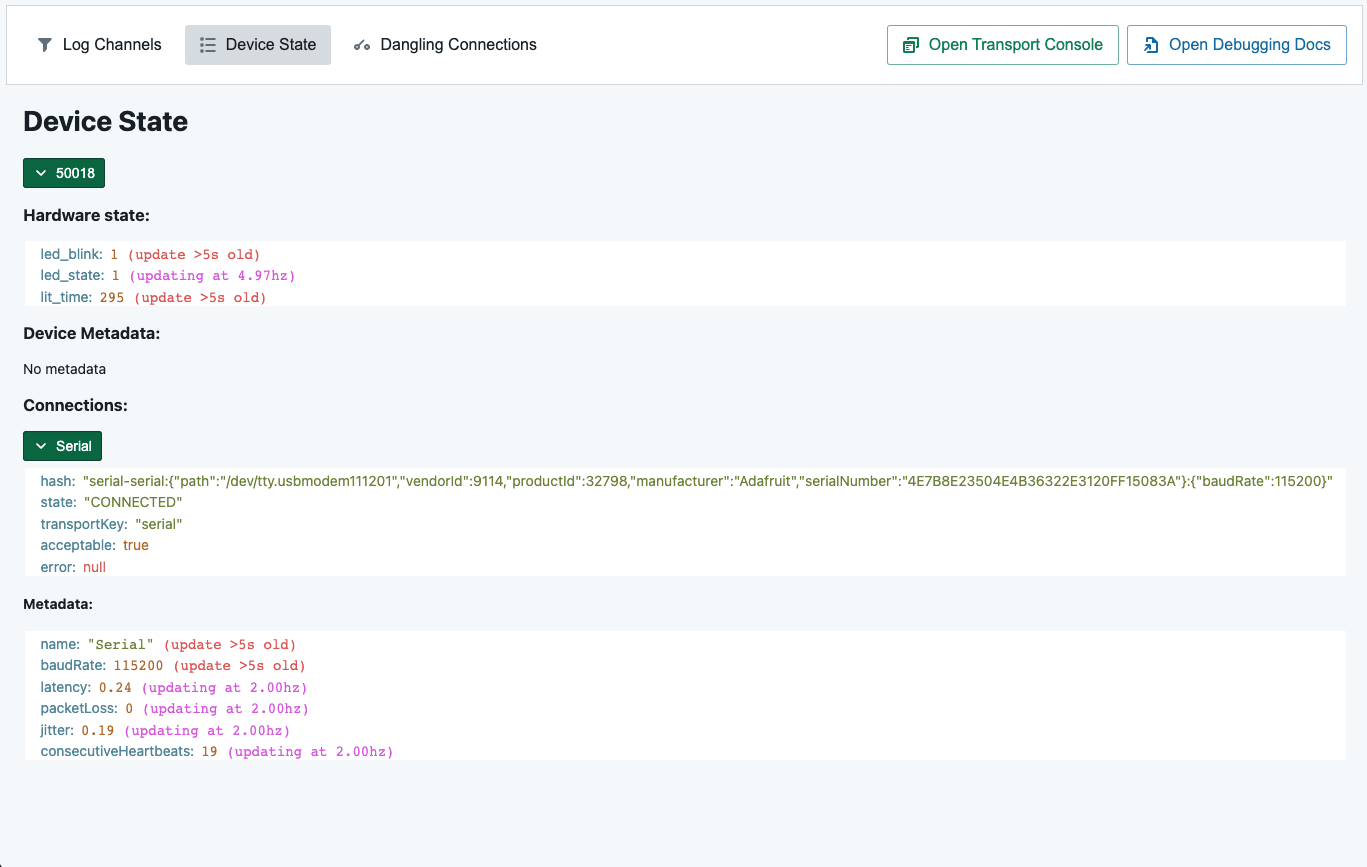
Device State tab
The Transport Manager includes a full view of the device and connection state trees. To access it, use the DevTools Menu to access the Transport Window, then switch to the Device State tab.
Performance Testing
To diagnose timing or frame-rate issues, the Performance tab offers a suite of diagnostic tools.
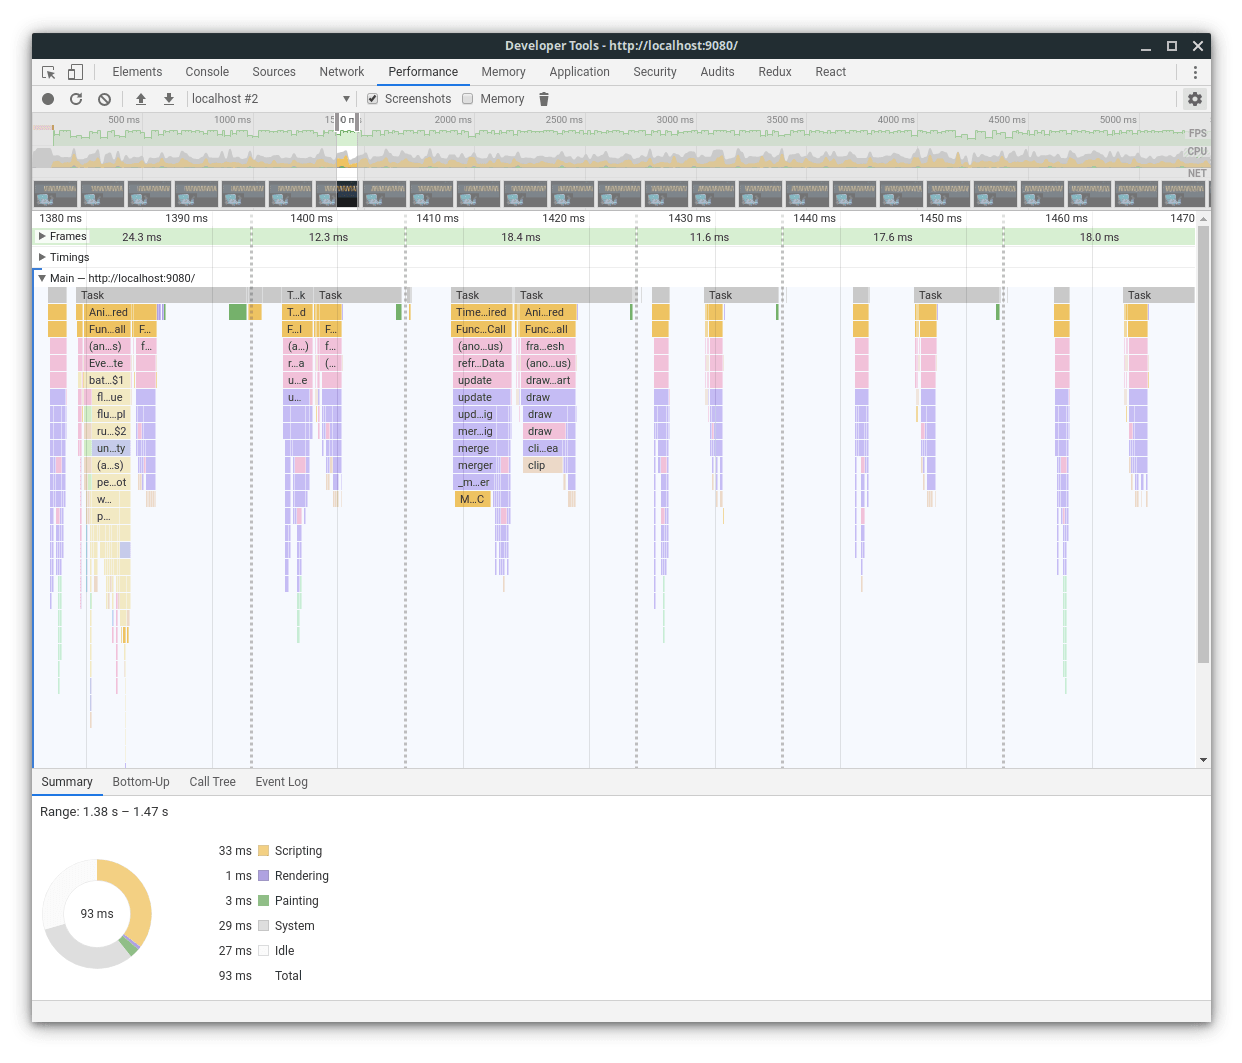
- Click the record button in the top left of the developer tool window, and interact with the UI as needed.
- Press stop, and the recorded section displays as a flamegraph.
- Drag a selection over the flamegraph or frame-timing bars to focus the horizontal axis over the selected slice.
The performance logging process is resource intense and may have a negative impact on your applications performance during recording.
The Window Manager
The window manager is responsible for creating and managing the render windows, global shortcuts, native menus and dialogs. It can be debugged using a Chrome webbrowser to connect to it remotely.
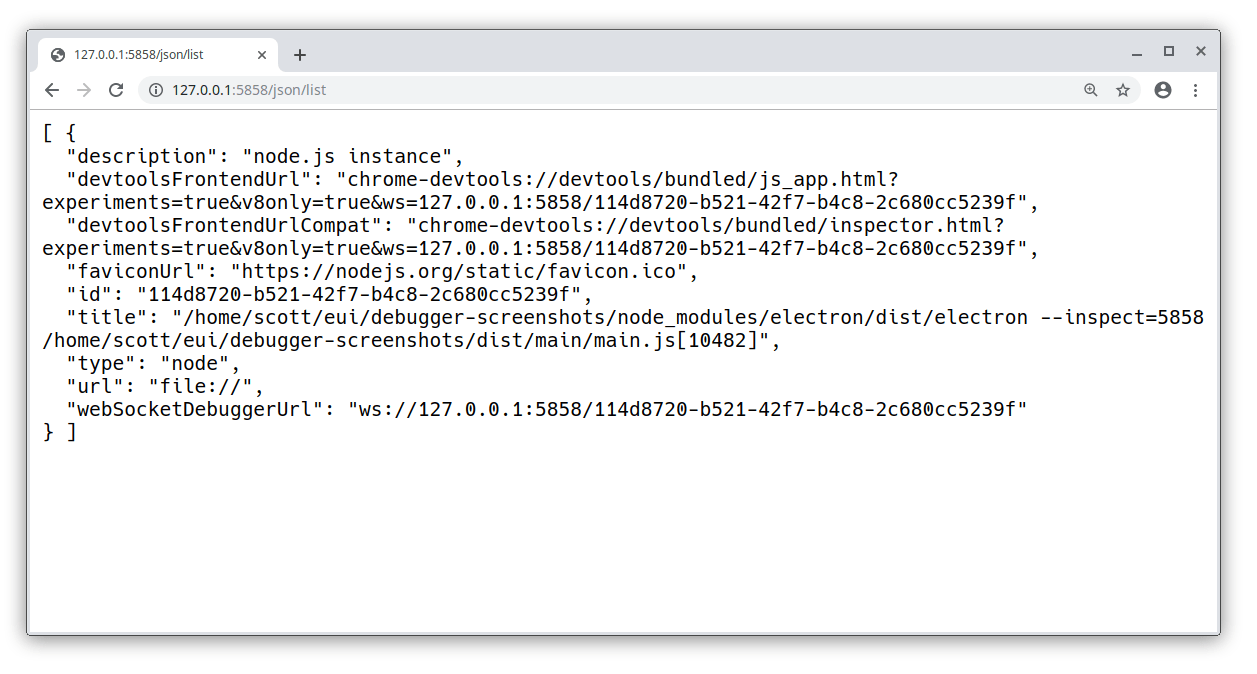
arc prints some information to the console after launch which looks like:
scott@octagonal $ arc start✓ Compiled transport bundle successfully.✓ Compiled renderer bundle successfully.Electron: Debugger listening on ws://127.0.0.1:5858/05e86500-287b-4771-a4f9-0d475b66f034Electron: For help, see: https://nodejs.org/en/docs/inspectorTo access the remote debugger, open a Chrome webbrowser and go to http://<host>:<port>/json/list, using the host and port provided in arc output URL. In this example, <http://127.0.0.1:5858/json/list>.
You should see something like this:
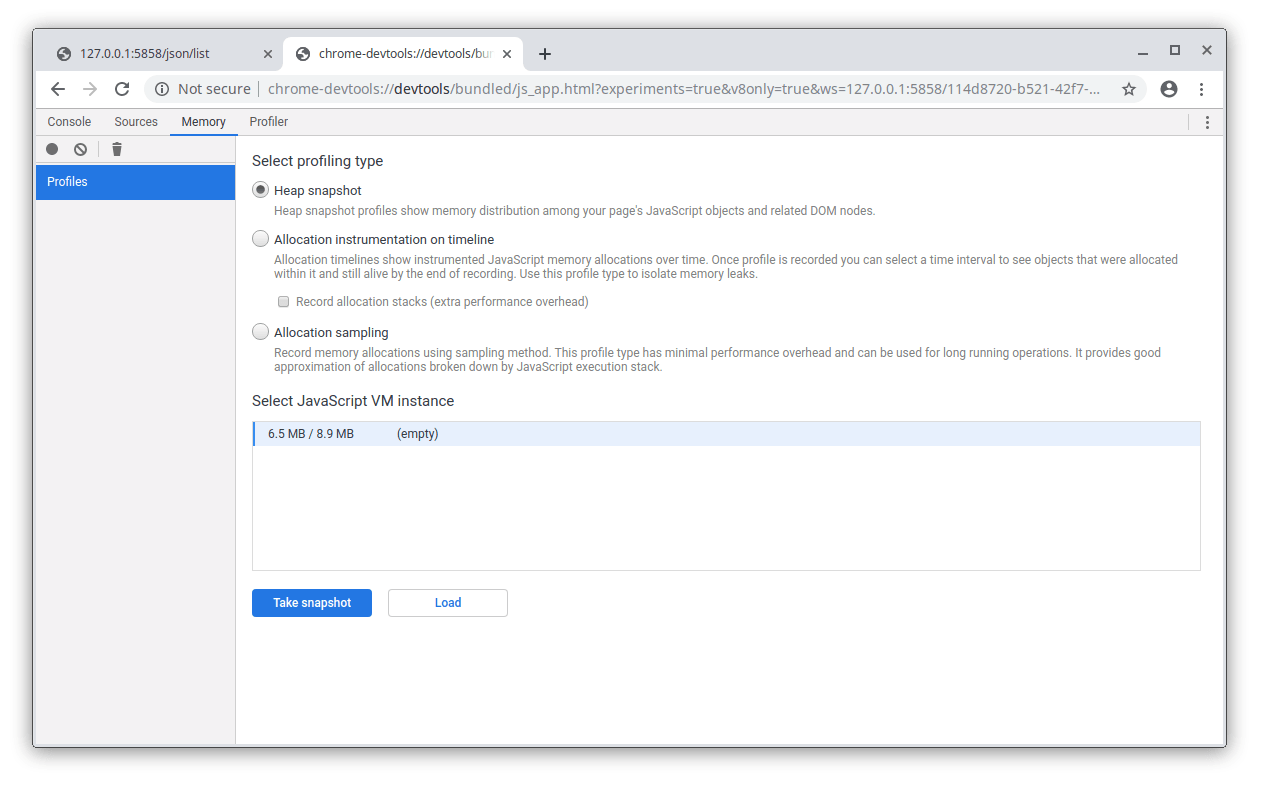
Open the remote debugger for Electric UI's root context by navigating to the devtoolsFrontendUrl listed on the json/list page.
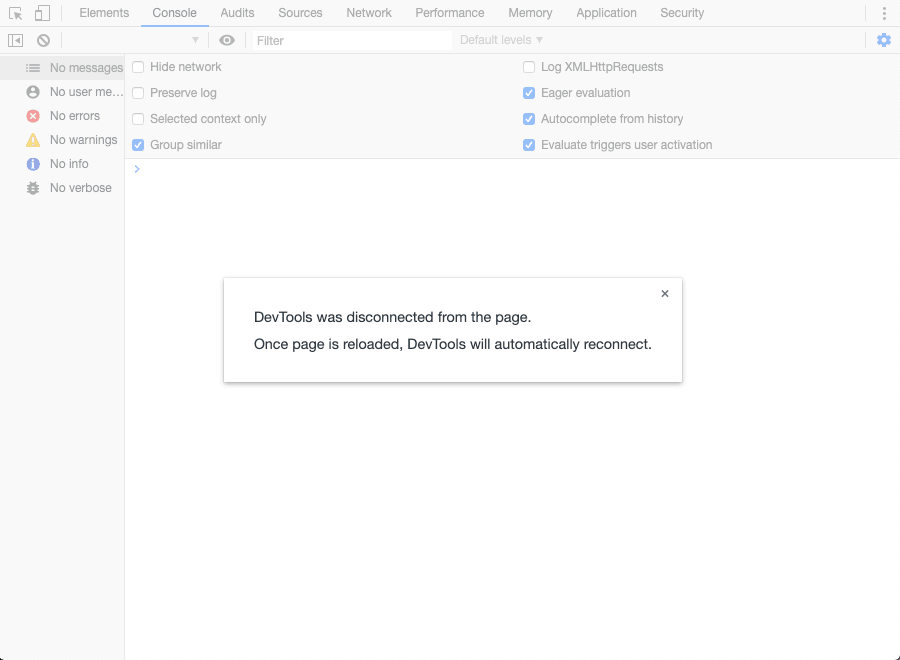
V8 crashes
In dire circumstances, v8 may crash, usually visible with this in the DevTools.
The next step is to enable Chromium logs, set the environment variable:
ELECTRON_ENABLE_LOGGING=true
Logs will be printed to the main commandline.