Statistics Operators
These dataflow functions are intended for statistics use. By default they operate on the window of the chart that queries them.
They optionally take a duration argument.
Statistics operators are useful for calculating signal statistics and can be charted directly, used to drive annotations, or as building blocks for transformer pipelines for custom signal analysis.
Internally, statistics operators use online algorithms, such as Welford's for computing variance. They each need O(N) memory to maintain state.
count
Returns the number of events in the query window.
import { useDataTransformer } from '@electricui/timeseries-react'import { count } from '@electricui/dataflow' const countDS = useDataTransformer (() => { return count (dataSource )})geometricMean

The Geometric Mean (Wikipedia) is often used with statistics and ratios.
Calculated as the "n-th root of the product of n numbers", i.e.
sqrt( a x b )cbrt( a x b x c )import { useDataTransformer } from '@electricui/timeseries-react'import { geometricMean } from '@electricui/dataflow' const gMeanDS = useDataTransformer (() => { return geometricMean (dataSource )})harmonicMean
The Harmonic mean (Wikipedia) is used for correctly averaging rates or ratios, and calculating parallel equvielent resistance.
A useful property of the harmonic mean is reduced weight for large values and increased weights for smaller values.
3 ---------- 1 1 1 - + - + - a b cimport { useDataTransformer } from '@electricui/timeseries-react'import { harmonicMean } from '@electricui/dataflow' const hMeanDS = useDataTransformer (() => { return harmonicMean (dataSource )})histogram
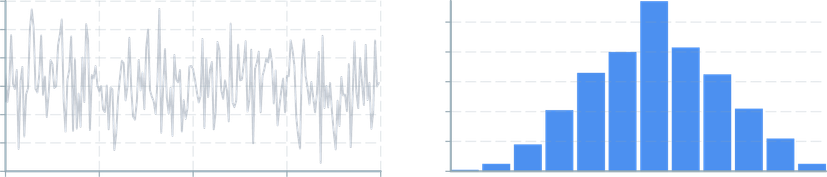
The histogram operator is a windowed aggregation function that buckets data based on a fixed number of buckets, and returns the collection of the counts in each bucket per event.
The min and max arguments specify the range of data expected, data outside this range will be ignored.
numBuckets determines how many buckets within this range will be used.
The accessor allows picking the specific piece of data in the event to aggregate. The operator also takes an optional duration, but defaults to the window of the chart that queried the operator.
import { useDataTransformer } from '@electricui/timeseries-react'import { histogram } from '@electricui/dataflow' const dataTransformer = useDataTransformer (() => { // 100 buckets of values between 0 and 200 const histo = histogram (dataSource , 0, 200, 100) return histo })interquartileRange

Interquartile Range (IQR, Wikipedia) describes the spread of data represented by the middle 50% of percentiles.
This transform can be used to represent the spread of your signal without impact from outliers, or as part of custom statistics calculations and visualisations.
Our implementation uses Reservoir Sampling to mantain a bounded memory footprint.
import { useDataTransformer } from '@electricui/timeseries-react'import { interquartileRange } from '@electricui/dataflow' const iqrDS = useDataTransformer (() => { return interquartileRange (dataSource )})max
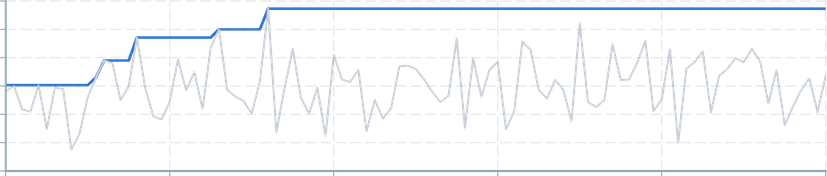
Returns the maximum value found in the query window.
Useful for drawing realtime annotations on charts.
import { useDataTransformer } from '@electricui/timeseries-react'import { max } from '@electricui/dataflow' const maxDS = useDataTransformer (() => { return max (dataSource )})min
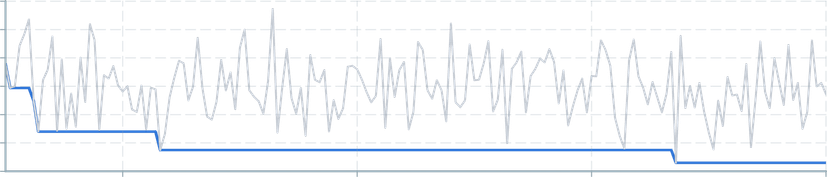
Returns the minimum value found in the query window.
Useful for drawing realtime annotations on charts.
import { useDataTransformer } from '@electricui/timeseries-react'import { min } from '@electricui/dataflow' const minDS = useDataTransformer (() => { return min (dataSource )})mean
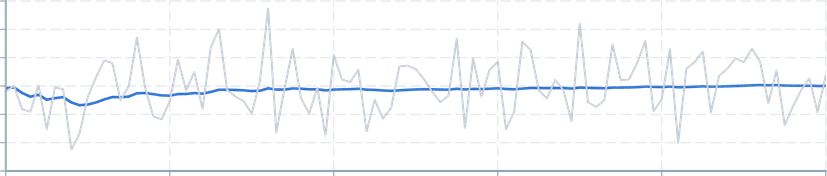
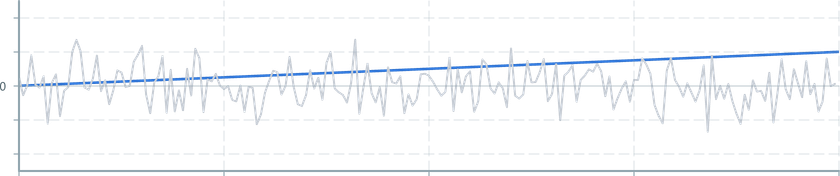
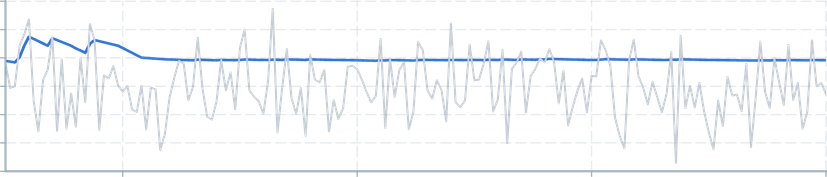
Returns the arithmetic mean (Wikipedia) value of events across query window. This is what most people would call the average.
This is calculated by summing all values then dividing the sum by the number of values.
a + b + c----------- 3import { useDataTransformer } from '@electricui/timeseries-react'import { mean } from '@electricui/dataflow' const averageDS = useDataTransformer (() => { return mean (dataSource )})meanAbsoluteDeviation
The Mean Absolute Deviation (AAD, or also called MAD), is the mean of the values deviating around the mean.
This is done by calculating the mean of the data, calculating the absolute difference between each value and the mean, then calculating the mean of the variation values.
Our implementation uses Reservoir Sampling to mantain a bounded memory footprint.
Commonly used to describe the variablility of a signal.
import { useDataTransformer } from '@electricui/timeseries-react'import { meanAbsoluteDeviation } from '@electricui/dataflow' const meanAbsDevDS = useDataTransformer (() => { return meanAbsoluteDeviation (dataSource )})median

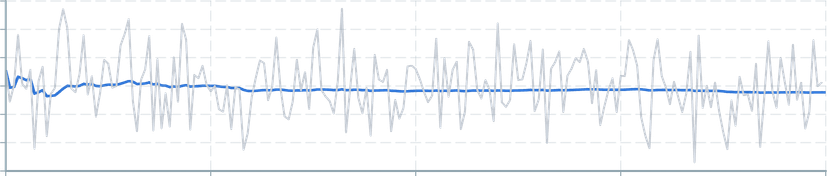
Returns the middle value across the window of data.
This is calculated internally by finding the value representing the quartile 0.5.
import { useDataTransformer } from '@electricui/timeseries-react'import { median } from '@electricui/dataflow' const medianDS = useDataTransformer (() => { return median (dataSource )})medianAbsoluteDeviation
The Median Absolute Deviation (MAD), represents the middle value in the range of deviations from the median.
This calculated by finding data's median value, then storing the absolute difference between each value and the median (in an AVLTree), then finding the median value of deviation values.
Our implementation uses Reservoir Sampling to mantain a bounded memory footprint.
Commonly used to describe signal variability, and can reject outliers more effectively than the standard deviation.
import { useDataTransformer } from '@electricui/timeseries-react'import { medianAbsoluteDeviation } from '@electricui/dataflow' const medianAbsDevDS = useDataTransformer (() => { return medianAbsoluteDeviation (dataSource )})mode
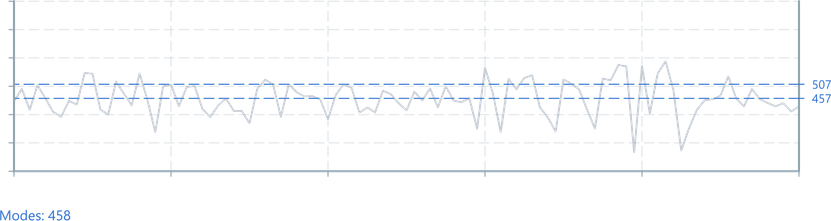
Returns a collection of values which occured most often in the query window.
We do not guarantee the results will be sorted.
import { useDataTransformer } from '@electricui/timeseries-react'import { mode } from '@electricui/dataflow' const modeDS = useDataTransformer (() => { return mode (dataSource )})If needed, consider chaining applicable operators such as min or max to return a single value in the event of multiple mode values.
product

Returns the product of all values in the query window.
import { useDataTransformer } from '@electricui/timeseries-react'import { product } from '@electricui/dataflow' const multipliedDS = useDataTransformer (() => { return product (dataSource )})quantile
Returns the value of a sample matching the user-specified probability.
Quantile accepts a number argument p between 0.0 and 1.0.
This implementation is Type 7 (h = (N − 1)p + 1), matching Julia and R's default settings, and also found in Excel as PERCENTILE, Python's numpy.percentile().
import { useDataTransformer } from '@electricui/timeseries-react'import { quantile } from '@electricui/dataflow' const quantileDS = useDataTransformer (() => { return quantile (dataSource , 0.8)})Our implementation uses Reservoir Sampling to mantain a bounded memory footprint. We internally implement this with an AVLTree
quantiles

Returns an array of samples matching the user-requested probabilities.
Quantile accepts an argument ps with an array of numbers between 0.0 and 1.0.
This implementation is Type 7 (h = (N − 1)p + 1), matching Julia and R's default settings, and also found in Excel as PERCENTILE, Python's numpy.percentile().
import { useDataTransformer } from '@electricui/timeseries-react'import { quantiles } from '@electricui/dataflow' const quantilesDS = useDataTransformer (() => { return quantiles (dataSource , [0.1, 0.4, 0.6, 0.9])})Our implementation uses Reservoir Sampling to mantain a bounded memory footprint.
rootMeanSquare
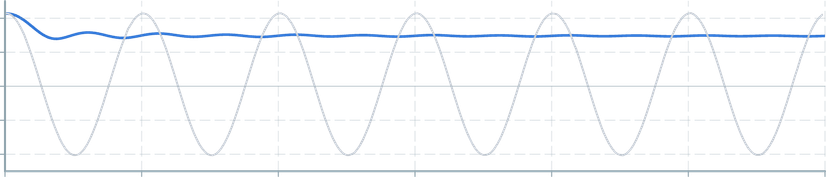
Returns the RMS value for the queried window of data.
Calculated by summing the square of each value, dividing by the number of values, then taking the square root.
import { useDataTransformer } from '@electricui/timeseries-react'import { rootMeanSquare } from '@electricui/dataflow' const rmsDS = useDataTransformer (() => { return rootMeanSquare (dataSource )})sampleStandardDeviation
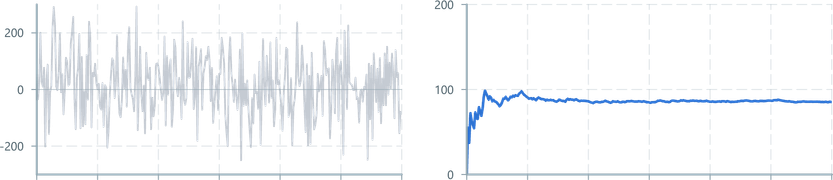
Returns the standard deviation of the input signal, assuming the window is a representative sample of the population (n - 1).
import { useDataTransformer } from '@electricui/timeseries-react'import { sampleStandardDeviation } from '@electricui/dataflow' const rmsDS = useDataTransformer (() => { return sampleStandardDeviation (dataSource )})sampleVariance
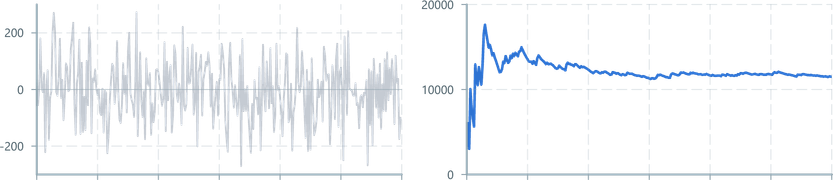
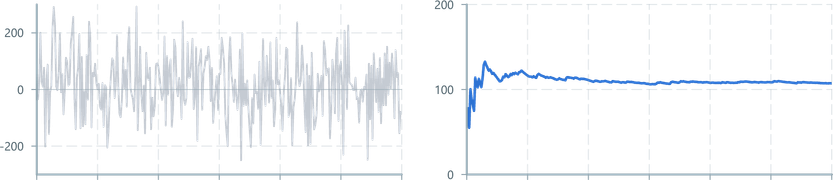
Returns the squared deviation from the mean, assuming the window is a representative sample of the population (n - 1).
Be aware that the result's units will be input units squared!
For example: The example motor speed tracking signal used above shows a noisy band of +-200RPM. It has a resulting variance just over 10,000.
import { useDataTransformer } from '@electricui/timeseries-react'import { sampleVariance } from '@electricui/dataflow' const sampleVarianceDS = useDataTransformer (() => { return sampleVariance (dataSource )})standardDeviation

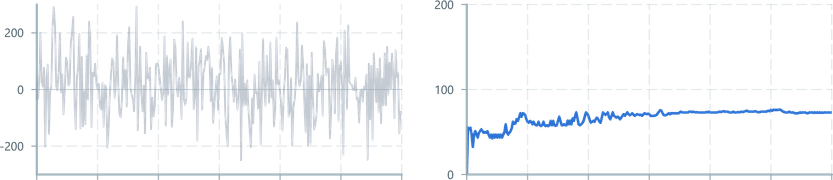
Returns the standard deviation of the input signal, where the window's data represents the entire population (n).
Our implementation uses Welford's Method
import { useDataTransformer } from '@electricui/timeseries-react'import { standardDeviation } from '@electricui/dataflow' const stdevDS = useDataTransformer (() => { return standardDeviation (dataSource )})sum
Returns the sum total of values across the query window.
import { useDataTransformer } from '@electricui/timeseries-react'import { sum } from '@electricui/dataflow' const sumDS = useDataTransformer (() => { return sum (dataSource )})variance

Returns the variance of the input signal, where the window's data represents the entire population (n).
Be aware that the result's units will be input units squared!
For example: The motor speed tracking signal used above shows a noisy band of +-200RPM. It has a resulting variance just over 10,000.
import { useDataTransformer } from '@electricui/timeseries-react'import { variance } from '@electricui/dataflow' const varianceDS = useDataTransformer (() => { return variance (dataSource )})