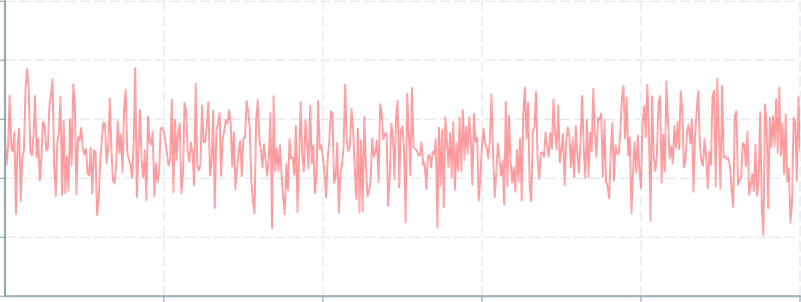
ChartContainer
ChartContainer is the foundational component responsible for rendering charts.
Usage
Charts use a composability model where a ChartContainer accepts child components responsible for specific sections of the chart's functionality.
The children of a ChartContainer cannot nest inside other components, or be moved into other components. They must be the flat children of the ChartContainer component.
import { ChartContainer , LineChart , RealTimeDomain , TimeAxis , VerticalAxis } from '@electricui/components-desktop-charts'import { useMessageDataSource } from '@electricui/core-timeseries' const OverviewPage = () => { const sensorDS = useMessageDataSource ('speed') return ( <React .Fragment > <ChartContainer > <LineChart dataSource ={sensorDS }/> <RealTimeDomain window ={10000} /> <VerticalAxis /> <TimeAxis /> </ChartContainer > </React .Fragment > )}To build out a typical chart, refer to the integration guide:
Size
By default, the chart will horizontally fill it's parent container.
Set the height of the ChartContainer by providing the height property a number value.
Default height is 200px.

<ChartContainer height ={350}> {/* Linechart, domain, etc */} <VerticalAxis /> <TimeAxis /></ChartContainer >Valid CSS sizing units are also accepted in string form, except for percentage based sizes. For example: 45rem, 500px, and viewport based sizing 20vh are valid:
<ChartContainer height ="20vh"> {/* ... */}</ChartContainer >To constrain the width, wrap the ChartContainer in an appropriately sized parent. div is used for demonstration purposes:

<div style ={{width : '250px'}}> <ChartContainer > {/* Linechart, domain, etc */} <VerticalAxis /> <TimeAxis /> </ChartContainer ></div >To force a width, provide a width value to the ChartContainer:
<ChartContainer width ={300}> {/* Linechart, domain, etc */} <VerticalAxis /> <TimeAxis /></ChartContainer >Draw Order
The render-order of a ChartContainer follows the order as written in the ChartContainer, from top to bottom.

<ChartContainer > <LineChart dataSource ={sensorDS } color ={Colors .RED5 } /> <ScatterPlot dataSource ={sensorDS } accessor ={(data , time ) => ({ x : time , y : data })} color ={Colors .BLACK } /> {/* Axis, domain, etc */}</ChartContainer >
<ChartContainer > <ScatterPlot dataSource ={sensorDS } accessor ={(data , time ) => ({ x : time , y : data })} color ={Colors .BLACK } /> <LineChart dataSource ={sensorDS } color ={Colors .RED5 } /> {/* Axis, domain, etc */}</ChartContainer >Identifiers
Providing a string to the id property allows other components to selectively interact with the container.
<ChartContainer id ='SystemPower'>Legacy Fallback
While handled automatically, the container can be forced to render with WebGL1 instead of the default WebGL2 by including the boolean legacy prop.
If you need to use this, please get in touch so we can help out!