ZoomBrush
ZoomBrush provides users with interactive control over the time domain window.
Usage
Implementation is achieved through two parts:
ZoomWrapper, which helps 'join' the zoom context across different ChartContainers,ZoomBrush, provides the user input handling and control visualisation.
This approach allows a single ZoomBrush to override multiple charts if needed, often useful when displaying synchronised signals in distinct ChartContainer components. By default the entire application is encompassed within a single ZoomWrapper, so for simple applications with a shared time basis, only the ZoomBrush component is required.
This API reference assumes familiarity with basic Charting concepts.
The simplest implementation is a single chart which supports ZoomBrush.
import { ChartContainer , LineChart , RealTimeDomain , TimeAxis , VerticalAxis , ZoomBrush } from '@electricui/components-desktop-charts'import { useMessageDataSource } from '@electricui/core-timeseries' const OverviewPage = () => { const sensorDS = useMessageDataSource ('fan_speed') return ( <> <ChartContainer > <LineChart dataSource ={sensorDS } /> <RealTimeDomain window ={10000} /> <TimeAxis /> <VerticalAxis /> <ZoomBrush /> </ChartContainer > </> )}The RealTimeDomain will override its domain if the ZoomBrush selects a region, and will regain control when the region is unselected. (This behaviour can be disabled with the ignoreZoom prop). All domains support this kind of zoom override.
ZoomWrapper
This wrapper allows a ZoomBrush to control ZoomDomain across many ChartContainer components.
Unlike most charting components, it does not require any specific parent components. ChartContainers will reach up to the closest ZoomWrapper and bind to it.
Multi-zoom behaviours are achieved through the automatic creation of an internal
ZoomManager, responsible for handling state and notifying the subscribedZoomDomainchildren.
ZoomBrush
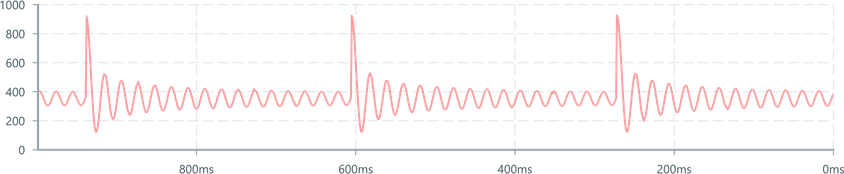
This is the user-interactive 'brush control'. Dragging on a horizontal slice of data will set the time window to that slice.
Clicking without selecting will reset the window.
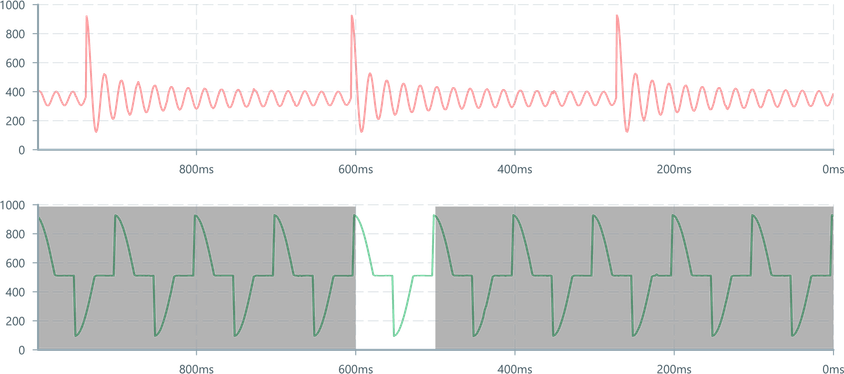
As an overview control
alwaysDisplayRange is used alongside a standard RealTimeDomain with ignoreZoom set to visualise the user's selected range as a slice of the domain.

This is most effective when combined with a long-running time window and small ChartContainer height. This provide a 'global timeline' style of interaction and the additional 'time slice context' helps improve general navigation while zoomed.