ColorMix transformer for charting
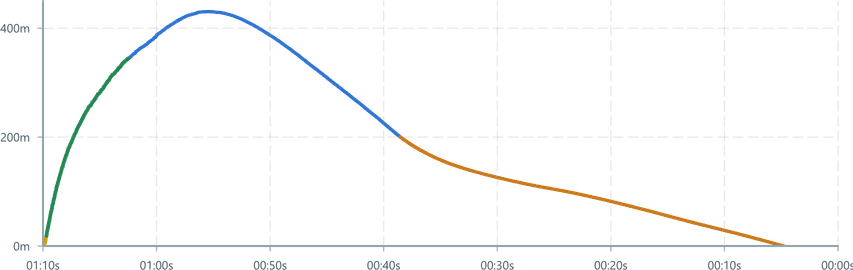
Imagine a rocket that has its own internal state machine, and a set of XYZ coordinates. The goal is to graph the XYZ coordinates as it flies, with the line's color coded to the current state of the rocket.
Writing a custom transformer
Instead of a bare DataTransformer, this example will create a reusable DataFlow operator combining other operators, allowing more powerful visualisation of streamed data.
// @filename: colorMixer.tsimport { forEach , map , interleave , DataTransformer } from '@electricui/dataflow'import { useMessageDataSource , Event , Queryable } from '@electricui/core-timeseries' export type XYZEvent = { x : number y : number z : number} export type ColorEvent = string // The colour is simply a string export function colorMixer ( colorQueryable : Queryable <ColorEvent >, xyzQueryable : Queryable <XYZEvent >, defaultColor : string,) { // The starting state is the default color let currentColorState = defaultColor // For every color change event (driven by our hardware state changes later on) // set the current color const colorSetter = forEach (colorQueryable , (data , time ) => { currentColorState = data }) // For every position update, create a new Event that contains the color information // of the last received color update as well const colorXYZ = map (xyzQueryable , (data , time ) => { return { x : data .x , y : data .y , z : data .z , color : currentColorState , } }) // Interleave the two streams return interleave ([colorXYZ , colorSetter ])}The colorMixer will interleave the sorted streams, making sure that both historical and future updates happen in the correct order.
Mapping states to colors
The hardware sends it's estimated state to the UI, represented with enum values HARDWARE_STATES in this example.
A DataTransformer takes the state values and maps each to a unique color. This colour-over-time data can then be passed to the colorMixer.
// @filename: page.tsximport { colorMixer , XYZEvent , ColorEvent } from './colorMixer'import { DataTransformer , map } from '@electricui/dataflow'import { useMessageDataSource , Event , Query } from '@electricui/core-timeseries'import { Colors } from '@blueprintjs/core' enum HARDWARE_STATES { STARTUP = 0, THRUSTING = 1, COASTING = 2, CHUTE_DEPLOYED = 3,} const hardwareState = useMessageDataSource <HARDWARE_STATES >('state')const hardwarePosition = useMessageDataSource <XYZEvent >('xyz') const dataTransformer = new DataTransformer (() => { const stateToColor = map (hardwareState , (data , time ) => { switch (data ) { case HARDWARE_STATES .STARTUP : return Colors .GOLD3 case HARDWARE_STATES .THRUSTING : return Colors .GREEN3 case HARDWARE_STATES .COASTING : return Colors .BLUE3 case HARDWARE_STATES .CHUTE_DEPLOYED : return Colors .ORANGE3 default: return Colors .BLACK } }) const interleaved = colorMixer (stateToColor , hardwarePosition , 'black') return interleaved })Linechart Usage
With our XYZ data now alongside the colour information, we can use the vertex colour control feature.
<LineChart dataSource ={dataTransformer } accessor ={data => data .z } lineWidth ={4} colorAccessor ={(data , time ) => data .color }/>