LineChart
Charts provide realtime graphing of numeric data.
Charts rely on a DataSource to provide their data, most commonly this will be of the type MessageDataSource. It is recommended to read the DataSource documentation first.
Usage
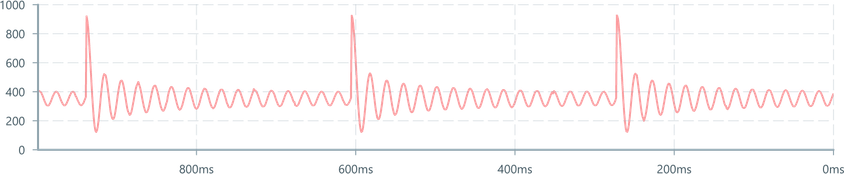
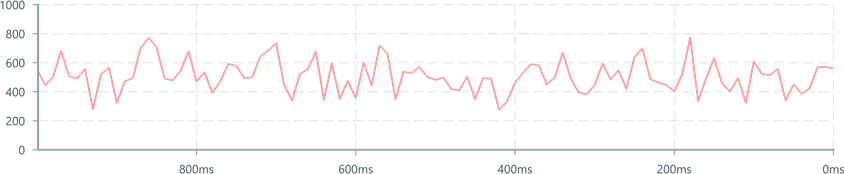
The most common use of a LineChart is to plot realtime streaming sensor data.
To use a LineChart:
ChartContaineris required to provide a parent contextMessageDataSourceis required to catch and format the relevant inbound messages- A
RealTimeDomainreferences the input data against time, and allows for window range control
import { ChartContainer , LineChart , RealTimeDomain ,} from '@electricui/components-desktop-charts'import { useMessageDataSource } from '@electricui/core-timeseries' const OverviewPage = () => { const signalDataSource = useMessageDataSource ('speed') return ( <React .Fragment > <ChartContainer > <LineChart dataSource ={signalDataSource } /> <RealTimeDomain window ={10000} delay ={50} /> </ChartContainer > </React .Fragment > )}The optional 50ms delay on the RealTimeDomain adds some latency to ensure that new events enter the chart 'smoothly' from the right hand side. When data streams in at higher rates, the gap between points is less noticable.
Most users commonly add axis frames to provide context to the data. Read the ChartAxis documentation for more detail and configuration.
<ChartContainer > <LineChart dataSource ={signalDataSource } /> <RealTimeDomain window ={10000} delay ={50} /> <TimeAxis /> <VerticalAxis /></ChartContainer >Plotting multiple lines
Plot an arbitrary number of signals on the same Chart by adding more <LineChart> children.
Each LineChart represents a draw call to the GPU under the hood.

To plot several different messages on the same Chart, you'll need to create a datasource per message ID.
<ChartContainer > <LineChart dataSource ={engineDataSource } /> <LineChart dataSource ={gearboxDataSource } /> <LineChart dataSource ={wheelDataSource } /> <RealTimeDomain window ={10000} /> <TimeAxis /> <VerticalAxis /></ChartContainer >For structured data where multiple plottable values are in the same packet, use the same datasource in each LineChart and provide an accessor function to select the desired member.
See the data source documentation for further information.
<ChartContainer > <LineChart dataSource ={tempDataSource } accessor ={(data , time ) => data .furnace } /> <LineChart dataSource ={tempDataSource } accessor ={(data , time ) => data .exhaust } /> <RealTimeDomain window ={30000} /> <TimeAxis /> <VerticalAxis /></ChartContainer >The
LineChartuses normal accessor syntax to select the data to plot, but instead of being passed the full state tree, it is passed only the contents of thetempmessage.
Line Width
The lineWidth property accepts a positive number representing the thickness of the line in pixels. Larger values increase thickness.
The default thickness is 2. The thickness behaves as expected on high-dpi displays (Retina@2x).
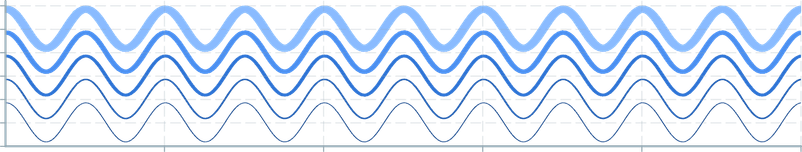
<LineChart dataSource ={sensorDS } lineWidth ={1}/><LineChart dataSource ={sensorDS } lineWidth ={2}/><LineChart dataSource ={sensorDS } lineWidth ={4}/><LineChart dataSource ={sensorDS } lineWidth ={10}/>Line Color
The color prop can be a string or number. Passing hex color="#0066cc locally is fine, but we recommend using centralised colors to maintain consistency.

import { Colors } from '@blueprintjs/core'<LineChart dataSource ={sensorDS } color ={Colors .RED5 } /><LineChart dataSource ={sensorDS } color ={Colors .GREEN5 } /><LineChart dataSource ={sensorDS } color ={Colors .BLUE5 } /><LineChart dataSource ={sensorDS } color ={Colors .GOLD5 } /><LineChart dataSource ={sensorDS } color ={Colors .SEPIA5 } /><LineChart dataSource ={sensorDS } color ={Colors .VIOLET5 } /><LineChart dataSource ={sensorDS } color ="#0066cc" />Vertex Color Control
Color can be specified per-vertex, useful for adding context to complicated signals.
The colorAccessor property provides the value of the signal and the timestamp, and expects a ThreeJS compatible color object to be returned.
For example, changing the color to highlight values outside a magnitude threshold:
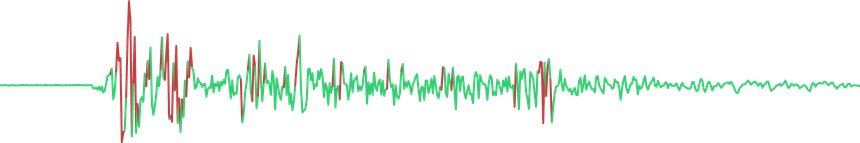
import { Color } from 'three' const col = new Color ()<LineChart dataSource ={quakeDS } color ={0xffffff} colorAccessor ={(data , time ) => { col .setHSL (0.4, 0.6, 0.5) if (data < 300 || data > 540) { col .setHSL (0.0, 0.5, 0.5) } return col .getHex () }}/>Note that each vertex can only have one colour applied. This can appear as a graphical 'error' in situations where a rapidly changing signal has too few points.
This approach can also highlight data within a specific timeframe of interest.
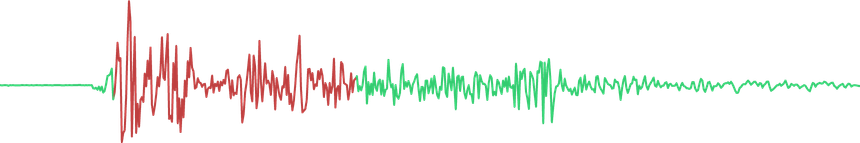
let timestamp = 0<LineChart dataSource ={quakeDS } color ={0xffffff} colorAccessor ={(data , time ) => { if (timestamp == 0) { timestamp = time } col .setHSL (0.4, 0.6, 0.5) if (time - timestamp > 80) { col .setHSL (0.0, 0.5, 0.5) } return col .getHex () }}/>Line Opacity
The opacity prop is a number that sets the global opacity of the line.
opacitySource and opacityAccessor allow for more control over Vertex level opacity, similar to the Vertex level line colouring.
Step Modes
By default, a LineChart will draw a line between each point of data. The step property allows overriding control of the rendering behaviour between data points.
It supports before, middle, after.
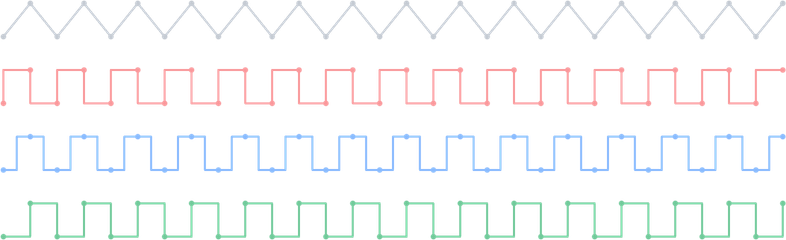
The dots rendered in this screenshot are only intended to illustrate the underlying data.
<LineChart dataSource ={alternatingDS } /><LineChart dataSource ={alternatingDS } step ="before"/><LineChart dataSource ={alternatingDS } step ="middle"/><LineChart dataSource ={alternatingDS } step ="after"/>Dashed Lines
Dashed lines can be enabled by enabling the dashed boolean property.
Additional control is exposed with the dashScale, dashSize, dashOffset and dashGapSize number properties.
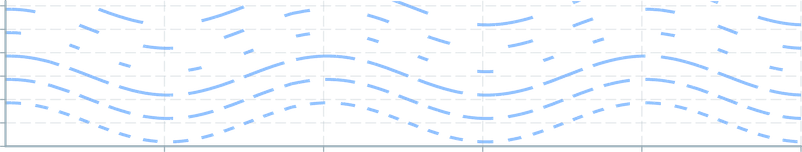
<LineChart dataSource ={sensorDS } dashed /> <LineChart dataSource ={sensorDS } dashed dashScale ={2}/><LineChart dataSource ={sensorDS } dashed dashScale ={4}/> <LineChart dataSource ={sensorDS } dashed dashSize ={2}/><LineChart dataSource ={sensorDS } dashed dashSize ={4}/> <LineChart dataSource ={sensorDS } dashed dashOffset ={2} /><LineChart dataSource ={sensorDS } dashed dashOffset ={4} /> <LineChart dataSource ={sensorDS } dashed dashGapSize ={2} /><LineChart dataSource ={sensorDS } dashed dashGapSize ={4} />Continuity
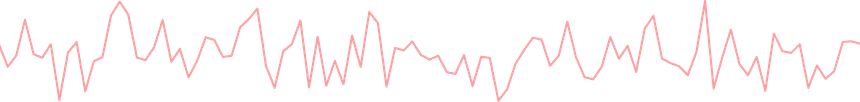
When connection is lost with a device and regained, most charting solutions span the gap with a line-segment.
Technically, this is a misleading presentation of the data.

By default, connection acceptability (A DataSource of type boolean) is used to punch gaps in the LineChart. This is a more accurate representation of the data.

To manually control continuity behaviour, the continuitySource prop accepts a Datasource of boolean type where a true describes a break in continuity, and false describes a return to continuity.
A 'hole' will be inserted at the time of the break, and no data will be drawn until continuity is restored.
By default, the continuity source is derived from the device's acceptability, a metric which lags slightly behind the ability for data to come in. Note that data received during this 'potentially unstable connection' state will not be drawn.
<LineChart dataSource ={sensorDS } continuitySource ={sensorInvalidDS }/>To opt-out of default continuity behaviour, pass null
<LineChart dataSource ={sensorDS } continuitySource ={null}/>continuityAccessor allows typical accessor syntax to use members of a structure as the flag.
Blanking
The blankingTrigger property accepts a DataSource. Any Event on this DataSource will wipe the internal store of data, resulting in a blank/empty line.
This can be used clear previous results in longer running test-bench usecases, or can be rapidly invoked to provide oscilloscope style redraw behaviour.
Accessor usage is not currenty supported.
Geometry Cache size
The LineChart component uses a statically declared internal buffer for geometry storage.
By default, this is internally managed, but can be overridden with the maxItems property to increase/reduce the potential RAM impact of the chart.
This is helpful when you know the incoming data stream is slow, only covers a short timespan, or if high bandwith data is being plotted (>10kps, >1M points).
Electric UI will internally allocate the internal ping-pong geometry buffers as deemed optimal for performance.
As such, the actual value may be some multiple of
4096entries.
<LineChart dataSource ={sensorDS } maxItems ={6000} />If
maxItemsisn't big enough to buffer for the selectedRealTimeDomain, then users will see data dropping off the end of the line.