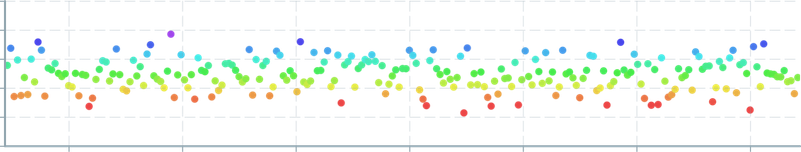
ScatterPlot Gradients
Quick example demonstrating a linear interpolation of hue based on a value, used for ScatterPlot point gradient formatting.
Transform functions
- Remap the input value from it's native value range to a 'percentage in range' -
inverse lerp, - Interpolate between two hue values using the 'percentage' calculated above -
lerp.
const lerp = (x : number, y : number, a : number) => x * (1 - a ) + y * a const clamp = (a : number, min = 0, max = 1) => Math .min (max , Math .max (min , a ))const invlerp = (x : number, y : number, a : number) => clamp ((a - x ) / (y - x ))This gives us the following function:
function valueToHue (value : number): number { const valueMin = 300 const hueMin = 0.0 const valueMax = 800 const hueMax = 0.8 // maps the raw value into a 0-1 based on min/max const valueInRange = invlerp (valueMin , valueMax , value ) // maps the 0-1 to a hue between the hueMin and hueMax const hue = lerp (hueMin , hueMax , valueInRange ) return hue }ScatterPlot Example
The transformation example above assumes a constant saturation and intensity will be used, resulting in a simple ScatterPlot colorAccessor implementation:
const col = new Color () return ( <ChartContainer > <ScatterPlot dataSource ={sensorDS } colorAccessor ={(data , time ) => { col .setHSL (valueToHue (data .y ), 0.8, 0.6) return col .getHex () }} /> <RealTimeDomain window ={10000} /> <VerticalAxis /> <TimeAxis /> </ChartContainer >)