ScatterPlot
Scatterplots are a LineChart alternative that allows for disconnected data points with configurable size and colors.
Charts rely on a DataSource to provide their data, and use a series of accessors to optionally control formatting. It is recommended to read the DataSource documentation first.
Usage
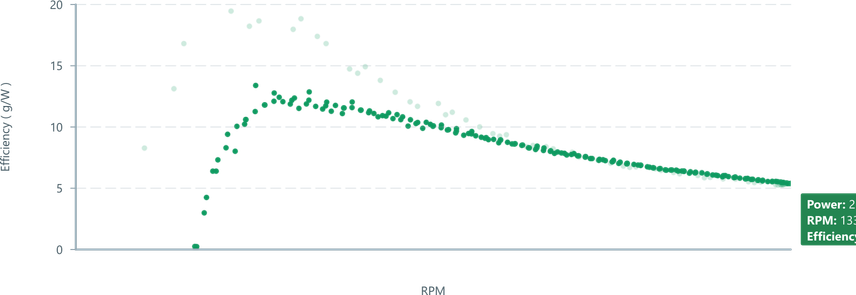
One common use of a ScatterPlot is to draw probabilistic sensor data, multidimensional signals, or signals which don't suit a 'line based' point-to-point relationship.
To use a ScatterPlot, the minimum requirements are similar to other chart types:
ChartContaineris required to provide a parent context,- A
MessageDataSourceorDataSourceto provide an inboundEventstream, - A domain,
RealTimeDomainorRealTimeSlicingDomain.
import { ChartContainer , ScatterPlot , RealTimeSlicingDomain , HorizontalAxis , VerticalAxis } from '@electricui/components-desktop-charts'import { useMessageDataSource } from '@electricui/core-timeseries' const OverviewPage = () => { // structured const sensorDataSource = useMessageDataSource ('propellor') return ( <React .Fragment > <ChartContainer > <ScatterPlot dataSource ={sensorDataSource } /> <RealTimeSlicingDomain window ={10000} /> <VerticalAxis /> <HorizontalAxis /> </ChartContainer > </React .Fragment > )}However, as ScatterPlot are often used for multidimensional, or non-timeseries data, some custom event processing will usually be required (or inbound data must be pre-structured) to provide suitable values for plotting.
Data Preparation
- Use a Transformer pipeline to format the
Eventstream, or - Use accessor syntax with
accessor, and optionallycolorAccessorandsizeAccessor, or - Provide a formatted
DataSourcewith structured fields:- Positioning of points with
xandyandzmembers, - Color control by providing
r,gandbmembersTHREE.Colororstring, - Size control with the
sizemember.
- Positioning of points with
Ultimately, positioning of the dots is achieved with
x,y,zmembers in theEvent.Optionally format each point with
size,r,g,bmembers.
Axis and Domains
Use TimeAxis with RealTimeDomain for conventional one-dimensional data streamed from hardware.
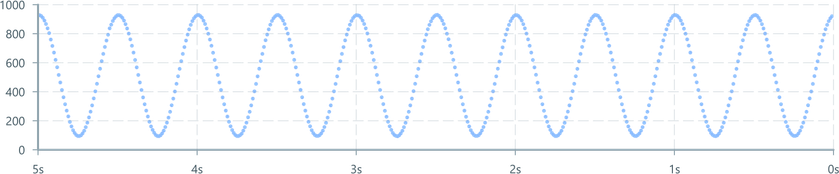
The simple numeric datasource is automatically handled.
import { ChartContainer , ScatterPlot , RealTimeDomain , TimeAxis , VerticalAxis } from '@electricui/components-desktop-charts'import { useMessageDataSource } from '@electricui/core-timeseries' const OverviewPage = () => { const analogDataSource = useMessageDataSource ('sine') return ( <React .Fragment > <ChartContainer > <ScatterPlot dataSource ={analogDataSource } /> <RealTimeDomain window ={10000} /> <VerticalAxis /> <TimeAxis /> </ChartContainer > </React .Fragment > )}For multi-dimensional data, use HorizontalAxis and RealTimeSlicingDomain.
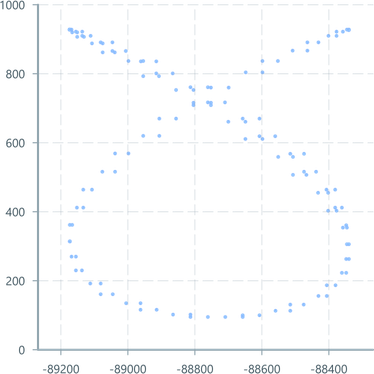
import { ChartContainer , ScatterPlot , RealTimeSlicingDomain , VerticalAxis , HorizontalAxis } from '@electricui/components-desktop-charts'import { useMessageDataSource } from '@electricui/core-timeseries'import { coalesce } from '@electricui/dataflow'import { useDataTransformer } from '@electricui/timeseries-react'import { Colors } from '@blueprintjs/core' const OverviewPage = () => { const xDataSource = useMessageDataSource ('lvdt_x') const yDataSource = useMessageDataSource ('lvdt_y') const manipulatedDataSource = useDataTransformer (() => { return coalesce ({x : xDataSource , y : yDataSource }) }) return ( <React .Fragment > <ChartContainer width ={400} height ={400}> <ScatterPlot dataSource ={manipulatedDataSource } color ={Colors .BLUE5 } size ={4} /> <RealTimeSlicingDomain window ={5000} xMin ={0} xMax ={1000} yMin ={0} yMax ={1000} /> <VerticalAxis /> <HorizontalAxis /> </ChartContainer > </React .Fragment > )}See the coalesce transformer documentation for notes on how DataSource pairs are being remapped to the x and y members required by ScatterPlot.
Geometry Cache size
The ScatterPlot component uses a statically declared internal buffer for geometry storage.
By default, this is internally managed, but can be overridden with the maxItems property to increase/reduce the potential RAM impact of the chart.
This is helpful when you know the incoming data stream is slow, only covers a short timespan, or if high bandwith data is being plotted (>10kps, >1M points).
Electric UI will internally allocate the internal ping-pong geometry buffers as deemed optimal for performance.
As such, the actual value may be some multiple of
4096entries.
<ScatterPlot dataSource ={analogDataSource } maxItems ={6000} />If
maxItemsisn't big enough to buffer for the selected domain, then users will see data dropping off the scatterplot.
Formatting
Global Color
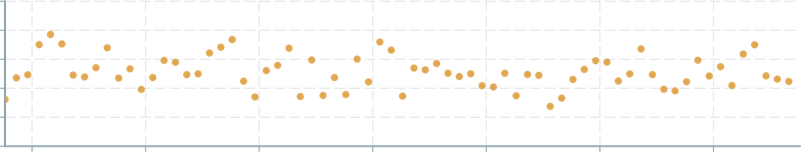
For global colour configuration, the color property accepts a string or number.
Passing hex color="#0066cc locally is fine, but we recommend using centralised colors to maintain consistency.
import { Colors } from '@blueprintjs/core'<ScatterPlot dataSource ={sensorDS } color ="#0066cc" /><ScatterPlot dataSource ={sensorDS } color ={Colors .GREEN5 } />It can also accept a threejs Color.
import { Color } from 'three' const OverviewPage = () => { const col = new Color () col .setHSL (0.1, 0.7, 0.6) return ( <React .Fragment > <ChartContainer > <ScatterPlot dataSource ={sensorDS } color ={col } /> <RealTimeDomain window ={10000} /> <VerticalAxis /> <TimeAxis /> </ChartContainer > </React .Fragment > )}Color Accessor
For per-point color control, use accessor syntax to return a string, hex value or threejs Color.
This can be used to highlight values of interest, or integrate another dimension of sensor data into the scatter point properties.
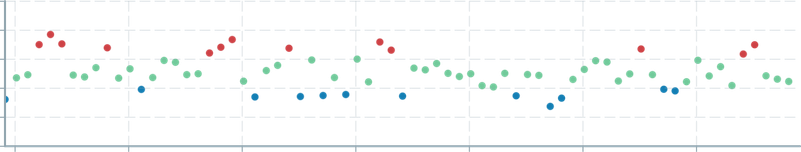
const OverviewPage = () => { function colorFromValue (value : number): string { if (value > WARN_HIGH ) { return Colors .RED3 } else if (value < WARN_LOW ) { return Colors .COBALT3 } else { return Colors .GREEN5 } } return ( <React .Fragment > <ChartContainer > <ScatterPlot dataSource ={sensorDS } colorAccessor ={(data , time ) => colorFromValue (data .y )} /> <RealTimeDomain window ={10000} /> <VerticalAxis /> <TimeAxis /> </ChartContainer > </React .Fragment > )}For a more complex example which interpolates color values, look at this example:
Global Size
Rendered point size is globally configured by providing the size property with a positive number.
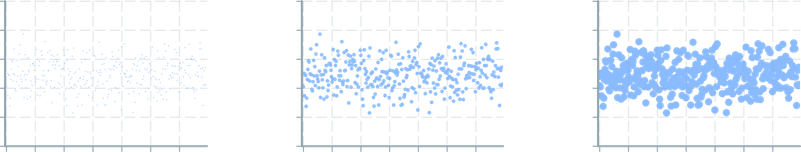
<ScatterPlot dataSource ={sensorDS } size ={1} /><ScatterPlot dataSource ={sensorDS } size ={4} /><ScatterPlot dataSource ={sensorDS } size ={8} />Size Accessor
For per-point size control, use accessor syntax to return a number.
An example use-case is conveying the signal-strength or confidence values of rangefinder sensors through variable sizing.
Carefully consider the legibility of your resulting plot with variable sizing, and consider clamping the minimum and maximum point size to legible values
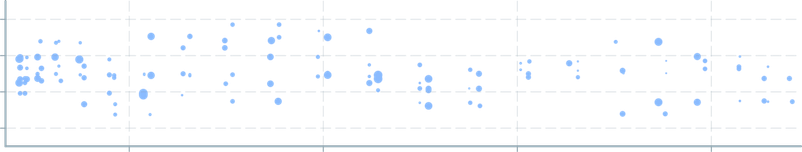
This example interpolates point sizing in a similar manner to the hue interpolation described in the Scatterplot Gradient Example.
const OverviewPage = () => { function valueToSize (value : number): number { // Normalise the raw value into 0-1 based on min/max const valueInRange = invlerp (SENSITIVITY_MIN , SENSITIVITY_MAX , value ) // Re-map the 0-1 to a clamped size const size = lerp (PT_SIZE_MIN , PT_SIZE_MAX , valueInRange ) return size } return ( <ChartContainer > <ScatterPlot dataSource ={lidarDS } color ={Colors .BLUE5 } sizeAccessor ={(data , time ) => valueToSize (data .strength ) } /> <RealTimeDomain window ={10000} /> <VerticalAxis /> <TimeAxis /> </ChartContainer > )}