Graphs and User Input
This guide will explain how to use mouse driven interactions to highlight data of interest and power context-driven annotations. You'll also learn how to build a custom interactive chart which allows end-users to control UI side DataTransformers with a Slider UI component.
What are Signals?
With typical inbound streams of data from hardware, the persistence engine and Dataflow allow Charts and DataTransformers to query against chunks of data to perform calculations and visualisations.
Some kinds of data never need historical data: user-configurations and dynamic input are obvious examples which are often needed when processing realtime streams of data or building annotations for charts.
A Signal is a container that can handle a single, most recent piece of data, but adds full support for existing Dataflow tooling.
This allows Dataflow and the query system skip processing for intermediate values and maintain a high performance level. Additionally, we're able to trigger re-renders when a signal is changed without waiting for new data in the DataSource stream to arrive.
Mouse position as a Signal
We'll jump right in and use one of our ready to use Signal sources, MouseCapture.
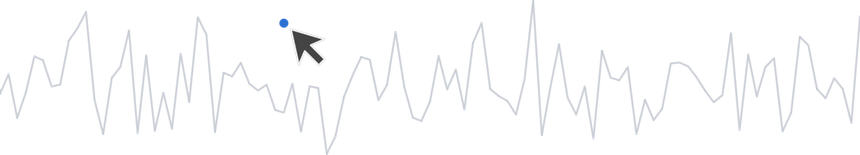
The useMouseSignal hook gives us a signal which we will call MouseSignal. It also provides a reference for the mouse handler, which we'll connect to the ChartContainer by adding a MouseCapture component to the container.
import { ChartContainer , LineChart , RealTimeDomain , TimeAxis , VerticalAxis , MouseCapture , useMouseSignal ,} from '@electricui/components-desktop-charts'import { useMessageDataSource } from '@electricui/core-timeseries' const OverviewPage = () => { const temperatureDS = useMessageDataSource ('temp_ptc') const [mouseSignal , captureRef ] = useMouseSignal () return ( <React .Fragment > <ChartContainer > <LineChart dataSource ={temperatureDS } /> <RealTimeDomain window ={1000} /> <TimeAxis /> <VerticalAxis /> <MouseCapture captureRef ={captureRef } /> </ChartContainer > </React .Fragment > )}Note: The blue dot and cursor icon are added for screenshots, default
MouseCapturedoesn't render anything.
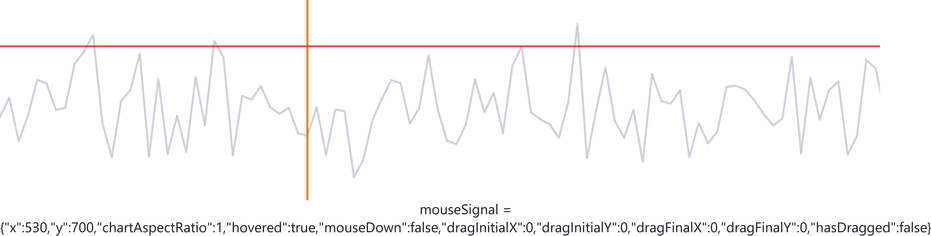
If we take a look at mouseSignal, we can see it's a MouseData object wrapped in a Signal.
The object has fields which are intended to help with a range of interaction and annotation tasks, but we're only interested in the x and y position values for now.
interface MouseData { hovered : boolean x : number y : number chartAspectRatio : number id ?: string | number}A Signal is immediately usable with any Dataflow compatible consumer - Charts, DataTransformers, etc.
So lets add annotations to our Chart using mouseSignal as the DataSource and use accessor syntax to choose the position members.
<VerticalLineAnnotation dataSource ={mouseSignal } accessor ={data => data .x } color ={Colors .ORANGE3 }/><HorizontalLineAnnotation dataSource ={mouseSignal } accessor ={data => data .y } color ={Colors .RED3 }/>But the true power of Signals is with their utility alongside DataFlow. Lets use DataFlow operators to find the closest point in our signal to the cursor.
There are different search operators available, the two most useful ones are:
closestSpatiallyfinds the point geometrically closest to the cursorclosestTemporallyfinds an event closest to the time input.
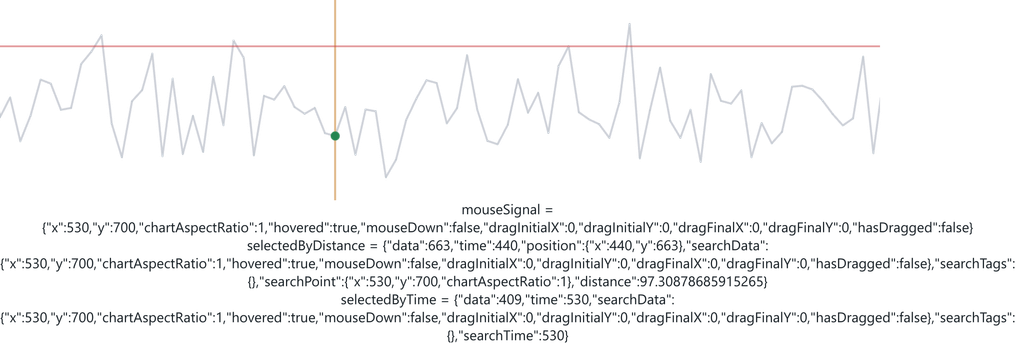
Play around with how these points behave when moving the mouse over your incoming data!
Now we'll cover how to use Signals with custom UI components.
Custom Signal components
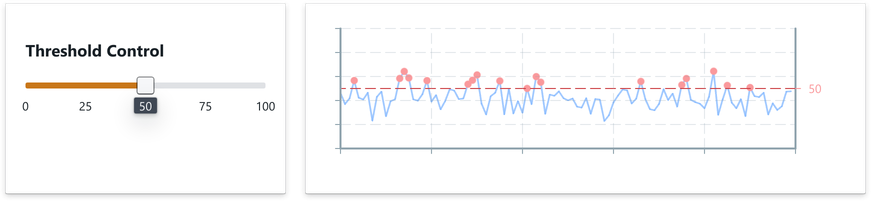
We'll build a simple UI which visualises a user-configurable threshold value and indicates if data has exceeded the threshold.
When building your UI, it's normal to isolate groups of UI elements into smaller modules.
Signals can be passed down to custom components as properties which can help to keep a consistent usage experience.
<Composition templateCol ="1fr 3fr"> <ControlCard threshold ={thresholdSignal }/> <ProcessedChart threshold ={thresholdSignal }/></Composition >Creation
An initalisation value must be provided during creation, which will implicitly determine the type of the Signal. The creation hook also provides a setter function.
import { useSignalProvider } from '@electricui/signals' const OverviewPage = () => { const [simpleSignal ] = useSignalProvider (true) const [thresholdSignal , setThresholdSignal ] = useSignalProvider (65)Once created, the type of a Signal cannot be changed.
Because they're generic, Signals are compatible with any valid Typescript structured data, and structure members can use accessor syntax to access specific data.
interface CalibrationData { uuid : string value : number} const defaultCalibration : CalibrationData = { uuid : 'Lidar4821C', value : 0.123 }const [calSignal ] = useSignalProvider (defaultCalibration )As mentioned in the intro and Mouse demo, Signals are immediately compatible with Charting components. We'll display the thresholdSignal with a YAxisAnnotation.
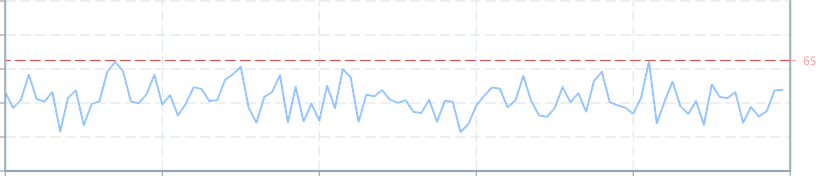
import { useMessageDataSource } from '@electricui/core-timeseries'import { Signal } from '@electricui/signals'import { ChartContainer , LineChart , YAxisAnnotation , VerticalAxis , TimeAxis , RealTimeDomain ,} from '@electricui/components-desktop-charts' interface ProcessedChartProps { threshold : Signal <number>} const ProcessedChart = (props : ProcessedChartProps ) => { const dataSource = useMessageDataSource ('ext_temp') return ( <ChartContainer > <LineChart dataSource ={dataSource } color ={Colors .BLUE5 } lineWidth ={2} /> <YAxisAnnotation dataSource ={props .threshold } color ={Colors .RED5 } gridColor ={Colors .RED3 } /> <VerticalAxis /> <TimeAxis /> <RealTimeDomain window ={10000} /> </ChartContainer > )}Subscribing to a Signal
To get state out of a signal, useSignal will read the value and ensure that any updates trigger a re-render of the React component.

import { Card } from '@blueprintjs/core'import { useSignal , Signal } from '@electricui/signals' interface ControlCardProps { threshold : Signal <number>} const ControlCard = (props : ControlCardProps ) => { const thresholdValue = useSignal (props .threshold ) return ( <Card > Threshold of: {thresholdValue } </Card > )}As with all of Electric UI's libraries, the type information should be correctly inferred in your IDE, we can see the thresholdValue value is inferred with the Signal's creation type of number.
Mutating a Signal
A setter function is provided during Signal creation, but if you've working with a Signal in a different scope (passed a Signal from a parent, etc) then it's more ergonomic to use the Signal's set method.
This overwrites the value stored by the Signal, and will trigger subscribers to re-render.
thresholdSignal .set (60)This makes it pretty easy to work with Control components like Sliders or RadioButtons,

import { Card , Colors , Slider } from '@blueprintjs/core'import { useSignal , Signal } from '@electricui/signals' interface ControlCardProps { threshold : Signal <number>} const ControlCard = (props : ControlCardProps ) => { const thresholdValue = useSignal (props .threshold ) const sliderOnChange = (value : number) => { props .threshold .set (value ) } return ( <Card > <h3 >Threshold Control</h3 > <Slider onChange ={sliderOnChange } min ={0} max ={100} value ={thresholdValue } labelStepSize ={50} /> </Card > )}DataTransformer watch
For streams of data which are infrequently updated, or have queries which aren't invalidated frequently (i.e. TriggerDomain), it's important for Signals to be able to trigger re-calculations of DataTransformers when the value changes.
DataTransformers provide a watch function which helps maintain a responsive user-experience. If the Signal changes, it will trigger the update and eventual re-render of Charted content.
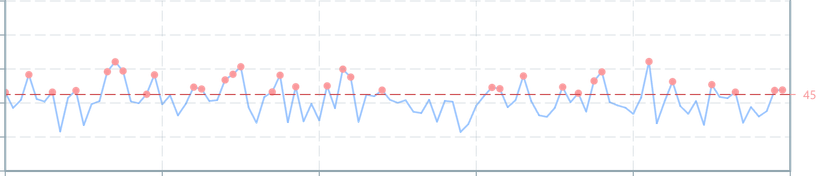
import { Signal } from '@electricui/signals'import { useDataTransformer } from '@electricui/timeseries-react'import { filter } from '@electricui/dataflow'import { ChartContainer , LineChart , ScatterPlot , YAxisAnnotation , VerticalAxis , TimeAxis , RealTimeDomain ,} from '@electricui/components-desktop-charts' interface ProcessedChartProps { threshold : Signal <number>} const ProcessedChart = (props : ProcessedChartProps ) => { const dataSource = useMessageDataSource ('ext_temp') const alertPoints = useDataTransformer (watch => { const limit = watch (props .threshold ) return filter (dataSource , data => (data > limit ) ) }) return ( <ChartContainer > <LineChart dataSource ={dataSource } color ={Colors .BLUE5 } lineWidth ={2} /> <ScatterPlot dataSource ={alertPoints } accessor ={(data , time ) => ({x : time , y : data })} size ={8} color ={Colors .RED5 } /> <YAxisAnnotation dataSource ={props .threshold } color ={Colors .RED5 } gridColor ={Colors .RED3 } /> <VerticalAxis /> <TimeAxis /> <RealTimeDomain window ={10000} /> </ChartContainer > )}What's Next?
Now that you've got an idea of how Signals can be used to handle immediate state and build more complex charts, have a look at the Legend component, browse the different Dataflow operators, and try building some more complex visualisations!