Data Transformers
This guide describes how to manipulate the fields in a DataSource, how to calculate a windowed average, apply a single-pole lowpass filter, cache min/max values, and implement a conditional trigger.
If you don't know what a DataSource is, read this guide first:
DataTransformers and DataFlow
For performing transformations on inbound data, as typically needed when plotting signals, we use a streaming data computation model.
By expressing the transformation as a computation on streams, the transformation can be run across both historical, static data, and future incoming data.
If data in the dependency tree is invalidated by changing historical data, the query will automatically re-calculate.
A DataTransformer provides a queryable form of a DataFlow, a program built with a tree of operators that modify the query on the way to the DataSource, and transform the Event returned on the way back.
The DataFlow executor can interleave multiple streams of data by their timestamp, perform stateful computation, and iteratively update the query as new data is fed in.
Anything from simple running averages, to complex filtering behaviour is possible with this computation system. Composed DataFlows can maintain internal state by capturing variables in their closure.
Simple Usage
A common use-case is running some simple maths on each value, we can do that with the map operator.
We'll also handle values which aren't realistic by chaining a filter operation.
import { useMessageDataSource } from '@electricui/core-timeseries'import { useDataTransformer } from '@electricui/timeseries-react'import { map , filter } from '@electricui/dataflow' const ChartPage = () => { const sensorDS = useMessageDataSource ('tempK') const transformedDS = useDataTransformer (() => { const celsiusEvents = map (sensorDS , (data , time ) => { return data + 273.15 }) const validEvents = filter (celsiusEvents , (data , time ) => { if (data >= -40 && data <= 500 ) { return true } return false }) return validEvents }) return ( <ChartContainer > <LineChart dataSource ={transformedDS } /> <RealTimeDomain window ={10000} /> </ChartContainer > )}It is important to wrap operators in a DataTransformer instead of querying them directly, as that can result in stale data across queries and hard to diagnose bugs.
For the full set of operations available, the API docs explain each option with code snippets and examples.
Custom Transformations
In this example, a DataSource provides XYZ position information over time, and emits global state change information in the form of a color.
The colorMixer DataFlow combines XYZ positions with the latest state color.
import { ChartContainer , LineChart } from '@electricui/components-desktop-charts'import { useMessageDataSource , Query , Queryable } from '@electricui/core-timeseries'import { useDataTransformer } from '@electricui/timeseries-react'import { forEach , map , interleave } from '@electricui/dataflow' type XYZEvent = { x : number y : number z : number}type ColorEvent = { color : string}type MixedEvent = XYZEvent & ColorEvent function colorMixer ( colorQueryable : Queryable <ColorEvent >, xyzQueryable : Queryable <XYZEvent >,) { let currentColorState = 'blue' const colorSetter = forEach (colorQueryable , (data , time ) => { currentColorState = data .color }) const colorXYZ = map (xyzQueryable , (data , time ) => ({ x : data .x , y : data .y , z : data .z , color : currentColorState , })) return interleave ([colorXYZ , colorSetter ])} export const ColorMixingChart = () => { const stateColDataSource = useMessageDataSource <ColorEvent >('state_col') const posDataSource = useMessageDataSource <XYZEvent >('pos') const dataTransformer = useDataTransformer (() => { return colorMixer (stateColDataSource , posDataSource ) }) return ( <ChartContainer > <LineChart dataSource ={dataTransformer } accessor ={data => data .z } lineWidth ={4} colorAccessor ={(data , time ) => data .color } /> </ChartContainer > )}Events are passed through the DataFlow system in temporal order. If any incoming event invalidates the sorting guarantees, the query is re-run to correct for the missing data.
┌─────────┐ │ │ ┌─────┐ ┌───┐ │ Color ├───►Green├────────────────────────►Red│ │ │ └──┬──┘ └─┬─┘ └─────────┘ │ │ │ │ │ │ ┌──▼──┐ ┌─────┐ ┌─────┐ │ ┌─────┐ │Green│ │Green│ │Green│ │ │ Red │ │ 1 ├─────► 2 ├─────► 3 ├──┴──► 4 │ └──▲──┘ └──▲──┘ └──▲──┘ └──▲──┘ │ │ │ │ │ │ │ │ ┌─────────┐ │ │ │ │ │ │ ┌┴┐ ┌┴┐ ┌┴┐ ┌┴┐ │ XYZ ├─────►1├─────────►2├─────────►3├─────────►4│ │ │ └─┘ └─┘ └─┘ └─┘ └─────────┘The DataTransformer creates a closure per query so that state can be maintained during a query's lifetime.
More complex examples
Color Mixer
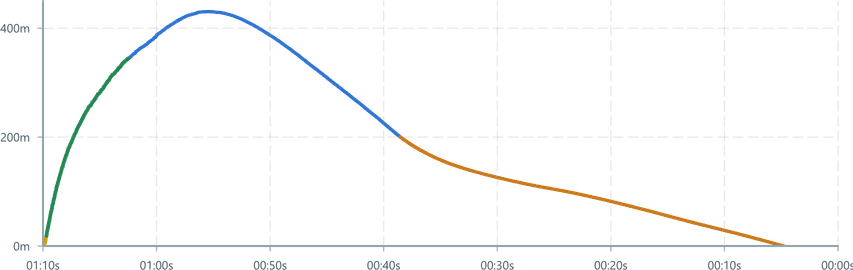
Imagine a rocket that has its own internal state machine, and a set of XYZ coordinates. The goal is to graph the XYZ coordinates as it flies, with the line's color coded to the current state of the rocket.
Instead of a bare DataTransformer, this example will create a reusable DataFlow operator combining other operators, and that will be passed to a DataTransformer.
Running Average
This example demonstrates a simple running average. Every time a new value arrives, the average of the last 10 items (inclusive of the newest value) is calculated and emitted.
When querying historical data, it fetches up to 10 items before the query start to pre-fill the buffer. This prefetching allows for a defined level of accuracy when querying historical data.
Again it is created as a reusable operator, then a DataTransformer is later used to consume it and the MessageDataSource
// @filename: rollingAverage.tsimport { prepare , map , interleave ,} from '@electricui/dataflow'import { FixedQueue , Queryable , Query , ORDERING , PERSISTENCE , Event } from '@electricui/core-timeseries' export function rollingAverage ( dataSource : Queryable <number>, bufferSize : number,) { // Allocate our circular buffer const buffer = new FixedQueue <number>(bufferSize ) // Prefetch up to `bufferSize` before the start of the query const prefetch = prepare (dataSource , query => { return query .clone () .limit (bufferSize ) // Fetch up to `bufferSize` events .end (query .getStart ()) // before the start of the current query .order (ORDERING .DESC ) // ordered latest to earliest, so the _last_ events are fetched .persist (PERSISTENCE .IMMEDIATE ) // fetching only events that are immediately available }) // The resultant batch will be ordered back-to-front, but the interleave operator // will automatically re-order the incoming events intelligently. // The prefetched events and the 'current' events will be combined into the same stream. const allEvents = interleave ([prefetch , dataSource ]) // The actual averaging occurs here: const averageEvents = map (allEvents , (data , time ) => { // Add the event to the queue buffer .push (data ) // Calculate the average over the queue let total = 0 buffer .forEach (val => { total += val }) const average = total / buffer .length // Return the average event return average }) // Return the averaged event stream return averageEvents }In use:
const OverviewPage = () => { const sensorDataSource = useMessageDataSource ('adc') const averagedSensorDataSource = useDataTransformer (() => { // Average the last 10 events return rollingAverage (sensorDataSource , 10) }) return ( <ChartContainer > <LineChart dataSource ={averagedSensorDataSource } /> <RealTimeDomain window ={10000} /> </ChartContainer > )}Leaky Integrator
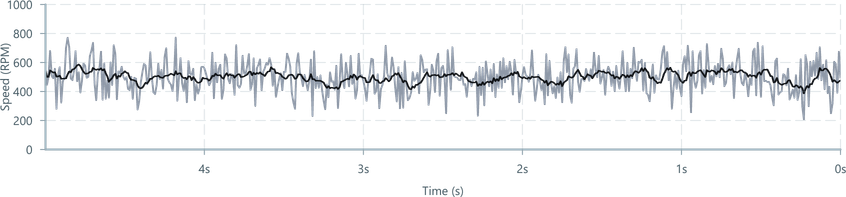
This example demonstrates a Leaky Integrator implementation. This style of filter is a commonly used first-order low-pass filter which has low computational overhead.
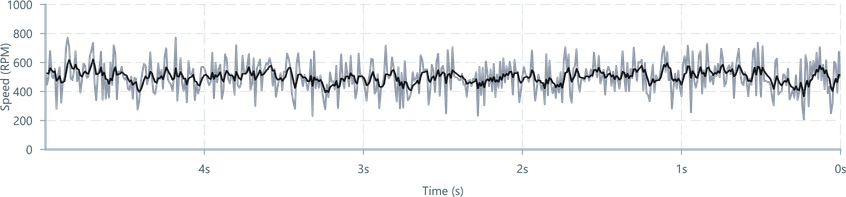
One benefit of this approach is the simple control over the filtering strength. α is the smoothing coefficient between 0 (no filtering = raw signal) and 1 (fully filtered = no output signal).
// @filename: leakyIntegrator.tsimport { filtermap } from '@electricui/dataflow'import { Queryable } from '@electricui/core-timeseries' export function leakyIntegrator ( queryable : Queryable <number>, smoothingFactor : number,): Queryable <number> { let lastValue : number | null = null const processed = filtermap ( queryable , (data , time ) => { // First run, just set the last data and exit if (lastValue === null) { lastValue = data return false } return true }, (data , time ) => { const thisValue = data const newData = (thisValue - lastValue !) / smoothingFactor + lastValue ! lastValue = newData return newData }, ) return processed }To use it, import the custom transformer and use it like normal:
const FilteredChart = () => { const sensorDataSource = useMessageDataSource ('adc') const filteredDataSource = useDataTransformer (() => { return leakyIntegrator (sensorDataSource , 0.25) }) return ( <ChartContainer > <LineChart dataSource ={filteredDataSource } /> <RealTimeDomain window ={10000} /> </ChartContainer > )}The above example demonstrates the process of implementing the transformer.
A pre-made
leakyIntegratoris available in@electricui/dataflow, though the strength factor argument describes the amount of filtering as a factor of the input - i.e strength of 2 isα = 0.5