BarChartDomain
BarChartDomain provides a RealTimeSlicingDomain equivelent, with specific performance and functional improvements for BarCharts.
Usage
The BarChartDomain performs several optimisations over the RealTimeSlicingDomain for use case of BarChart. It only renders on data change instead of each frame, and mitigates clock drift artifacts between the hardware and final display.
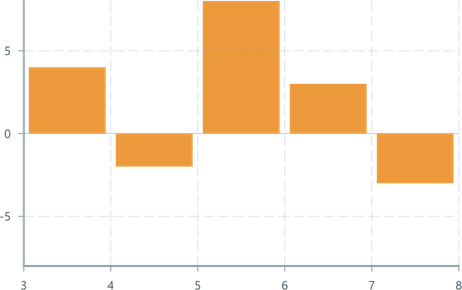
import { ChartContainer , BarChart , BarChartDomain ,} from '@electricui/components-desktop-charts'<ChartContainer > <BarChart dataSource ={dataSource } columns ={10} color ={Colors .ORANGE4 } barWidth ={16} barGap ={1} /> <BarChartDomain xMin ={3} xMax ={8} yMin ={-8} yMax ={8}/> <VerticalAxis /> <HorizontalAxis /></ChartContainer >To for information on charting, refer to the integration guide and the BarChart component docs.
Specifying data ranges
By default, the chart will autoscale both the x-axis and y-axis based on the range of visible data. Zero height columns will be truncated.
Constrain either the minimum, maximum, or both bounds in either or both axis with the xMin, xMax, yMin, and yMax properties. If the domain is known, it is recommended to constrain it as a performance optimisation.
Soft constraints can be added to provide a minimum extent with the xMinSoft, xMaxSoft, yMinSoft, and yMaxSoft properties. If the data exceeds the soft constraint, the chart will autoscale. If the data does not exceed the soft constraint, the soft constraint is used as the domain.
<BarChartDomain xMin ={3} xMax ={8} yMin ={-8} yMax ={8}/>