Array Variable Tips
Many embedded systems use groups of similar sensors, or provide an array of values which need to be displayed, post-processed, and logged.
This example describes how to more easily handle unknown-length array style usage with Electric UI codecs and components.
Codecs
It's good practice to write codecs with the ability to accept arrays of the custom type.
This decouples the UI's handling of data from the number of elements being sent from hardware - allowing different hardware versions to send more or less data without the UI layout breaking.
- Create an empty array of the custom structure
- Read the inbound data buffer
- Parse data into a structure element,
- Push it into the array once complete,
- Continue until no inbound data remains.
- Return the array of structures for use in the UI layout (usage discussed later in this guide).
This example is specific to the decoder function, but the approach is generalisable:
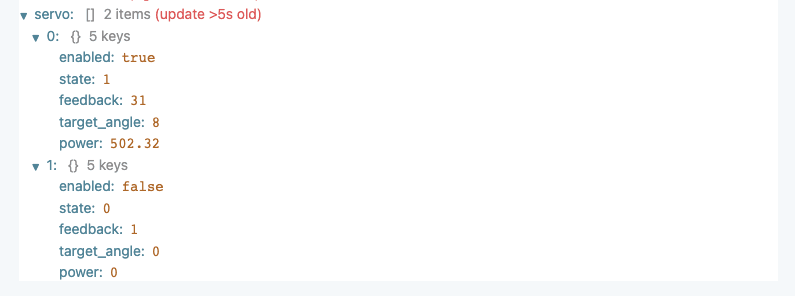
export class MotorDataCodec extends Codec { filter(message: Message): boolean { return message.messageID === 'servo' } encode(payload: ServoInfo): Buffer { throw new Error('Servo Telemetry is read-only') } decode(payload: Buffer): ServoInfo[] { const reader = SmartBuffer.fromBuffer(payload) const servoMotors: ServoInfo[] = [] while (reader.remaining() > 0) { const motor: ServoInfo = { enabled: reader.readUInt8() === 0x01 ? true : false, state: reader.readUInt8(), feedback: reader.readInt16LE() / 10, target_angle: reader.readFloatLE(), power: reader.readFloatLE(), } servoMotors.push(motor) } return servoMotors }}In operation, the data will display in the Device State viewer as an array of objects
UI Component layout
For displaying multiple components on the UI based on hardware info, iterate across the eUI data or a number provided by hardware.
Logging columns from an array
Instead of adding columns manually to the array at the component level (like this naive example),
<PolledCSVLogger interval={50} columns={[ { dataSource: spectraDataSource, column: `${SpectraWavelengths[0]}nm`, accessor: event => event[0], }, { dataSource: spectraDataSource, column: `${SpectraWavelengths[1]}nm`, accessor: event => event[1], }, { dataSource: spectraDataSource, column: `${SpectraWavelengths[2]}nm`, accessor: event => event[2], }, { dataSource: spectraDataSource, column: `${SpectraWavelengths[3]}nm`, accessor: event => event[3], } ]} />Column Name Formatting
describes the column name string format syntax - this example is referencing the first index of an array containing the wavelength's in nanometers.
For this example, the spec message ID is an array of uint16_t number values which use electricui-embedded's default codec, and we'll create a column in the log file for each value.
-
Get the hardware state for our data, formatted as a number array, or possibly null if it doesn't exist
-
Get the array element count
What the ?. ??
When getting the length of the spectralData number array (
spectralData?.length), the?.or 'optional chaining' operator allows the attempt to fetch a deeply nested property, falling back to null if the shallow property doesn't exist. IfspectralDatais null, then thelengthproperty won't exist, and optional chaining evaluates the whole expression tonull.This is required because
spectralDatawill be null ifuseHardwareState()can't find our data.The
??or 'nullish coalescing' operator returns its right-hand side operand (in this case 0) when its left-hand side operand is null or undefined (ifspectralDatais null), and otherwise returns its left-hand side operand (a non-nullspectralData). The nullish coalescing operator is used instead of a ternary operator because the number0is falsy, but may be a valid value forspectralData. (In this case it doesn't matter, but it's good practice to use explicit operators instead of relying on the falsy-ness of values.)
-
We can create an empty array of
EventColumnDataSourceorPolledColumnDataSourceobjects, -
Loop over the
specelements, formatting thexColumnDataSourcecolumn name and accessors as required, -
Push the
xColumnDataSourceto the array
const spectralData = useHardwareState('spec')const numWavelengths = spectralData?.length ?? 0let columnFields: PolledColumnDataSource[] = []if( numWavelengths > 0 ){ for(let wavelength = 0; wavelength < numWavelengths; wavelength++ ) { const field: PolledColumnDataSource = { dataSource: spectraDataSource, column: `${SpectraWavelengths[wavelength]}nm`, accessor: event => event[wavelength], } columnFields.push(field) }}<PolledCSVLogger interval={50} columns={columnFields}/>Other fields can be pushed into columnFields outside the for( ) when different variables or datasources are needed in the same logger.
Iteratively render custom components
First, separate out the display/formatting logic from the data. This snippet below is responsible for drawing a single structure of sensor data.
By adding fields to the props, it's possible to control formatting, labels or other behaviours based on the index of the variable when we run the map().
type SensorTelemetry = { data: SensorTelemetry}const SensorStats = (props: SensorTelemetry) => { return ( <React.Fragment> <h4> {props.data.name} </h4> <p> {props.data.powerW.toFixed(1)} W </p> </React.Fragment> )}We'll assume an unknown number of entries to iterate over.
- The
useHardwareStatehook provides the object, - A null check is performed if there's no message ID of
power_sen, - We render a Composition layout where each array member is a new entry to the grid.
- The
SensorStatsfunction we wrote above is called with relevant arguments to draw content.
- The
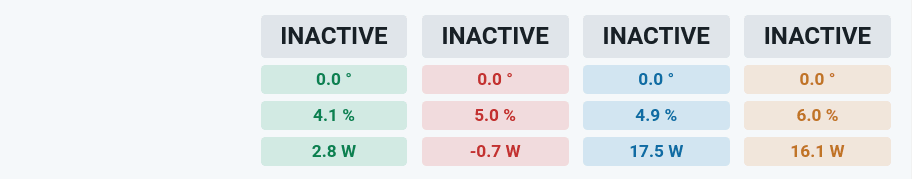
const SummaryCard = () => { const sensors: SensorTelemetry[] | null = useHardwareState(state => state.power_sen) if (sensors === null) { return <span>No telemetry available...</span> } return ( <Composition gap={10}> {sensors.map((sensor, index) => ( <Box key={index}> <SensorStats data={sensor}/> </Box> ))} </Composition> )}This approach makes repeated layouts far cleaner. By passing the index to the component layout function, we are able to modify the color property to distinguish each field
const servoColor: Intent[] = [ Intent.SUCCESS, Intent.DANGER, Intent.PRIMARY, Intent.WARNING,]const value_colour = servoColor[props.motorIndex]This approach is used in the Delta Robot user interface, source here for context.
Multi-line Charts
Similar to the above, we can iteratively add LineChart entries to plot an array of values easily.
For this example, we just have an array of standard number values.
export const ServoChart = () => { const numMotors: number | null = useHardwareState( state => (state.servo || []).length, ) const servoAngleDS = useMessageDataSource('servo') return ( <ChartContainer height={300}> {Array.from(new Array(numMotors)).map((_, index) => ( <LineChart dataSource={servoAngleDS} accessor={state => state.servo[index]} key={`angle_${index}`} /> ))} <RealTimeDomain window={30_000} /> <TimeAxis /> <VerticalAxis label="Angle °" /> </ChartContainer> )}