AreaChart
AreaCharts are a LineChart alternative which render the area under the line.
Charts rely on a DataSource to provide their data, and use a series of accessors to optionally control formatting. It is recommended to read the DataSource documentation first.
Usage
The recommended use for a basic AreaChart is to visualise data representing accumulated/sum quantities, or data often integrated over time. Some typical examples are the level of a storage tank, or rates of flow/consuption.
To use a AreaChart, the minimum requirements are similar to other chart types:
ChartContaineris required to provide a parent context,- A
MessageDataSourceorDataSourceto provide an inboundEventstream, - A domain,
RealTimeDomainorRealTimeSlicingDomain.
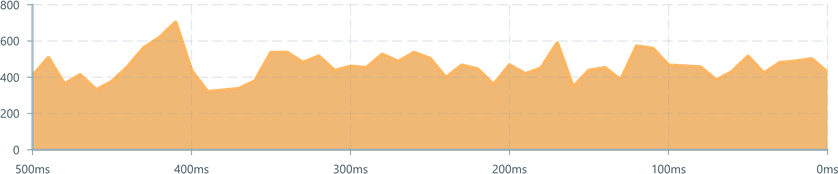
import { ChartContainer , AreaChart , RealTimeSlicingDomain , TimeAxis , VerticalAxis } from '@electricui/components-desktop-charts'import { useMessageDataSource } from '@electricui/core-timeseries'import { Colors } from '@blueprintjs/core' const OverviewPage = () => { const sensorDataSource = useMessageDataSource ('power') return ( <React .Fragment > <ChartContainer > <AreaChart dataSource ={sensorDataSource } color ={Colors .ORANGE4 }/> <RealTimeSlicingDomain window ={10000} /> <TimeAxis /> <VerticalAxis /> </ChartContainer > </React .Fragment > )}When plotting a single value, the default behaviour will shade the region under the curve.
Multiple AreaCharts
Like all other components in ChartContainer, the render order of components executes first-to-last.
If using multiple
AreaChartsin oneChartContainerwe recommend avoiding situations where signals can occlude each other, as this results in a poor user experience.
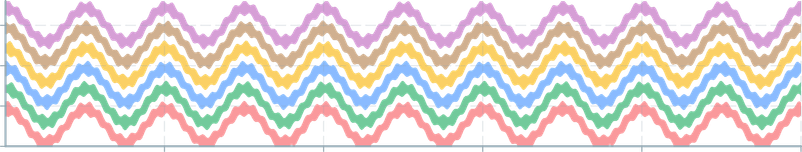
When plotting an AreaChart with other charts such as LineChart or ScatterPlot, we recommend placing the AreaChart first so it's 'behind' the other rendered elements.
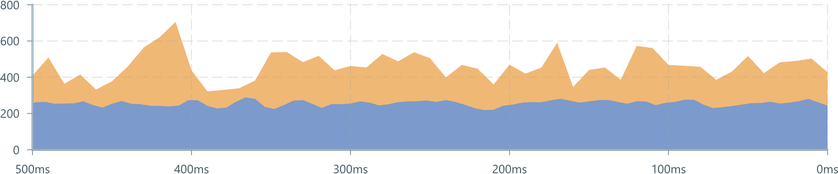
<ChartContainer > <AreaChart dataSource ={primaryDataSource } color ={Colors .ORANGE4 } opacity ={0.7}/> <AreaChart dataSource ={secondaryDataSource } color ={Colors .BLUE4 } opacity ={0.7}/></ChartContainer >This behaviour is an important part of building stacked area charts, we have a worked example which covers data processing.
Shading controlled regions
A DataSource which provides a pair of values, yMin and yMax, will fill the area between the curves and is useful for visualising confidence intervals or noisy data without overwhelming the end-user.
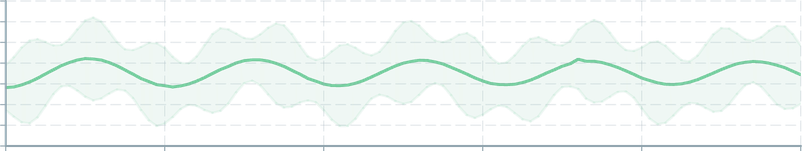
<AreaChart dataSource ={signalConfidence } color ={Colors .GREEN5 } opacity ={0.1} /><LineChart dataSource ={filteredSignal } color ={Colors .GREEN5 } lineWidth ={4} />A full worked example is available in the examples section:
Formatting
Color
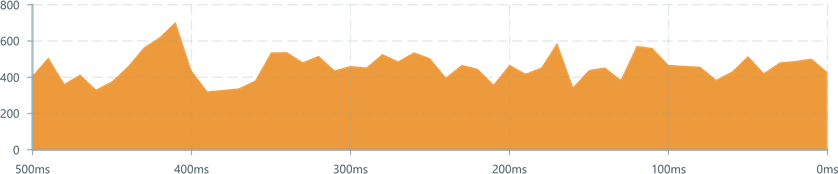
For global colour configuration, the color property accepts a string or number.
Passing hex color="#0066cc locally is fine, but we recommend using centralised colors to maintain consistency.
import { Colors } from '@blueprintjs/core'<AreaChart dataSource ={sensorDS } color ={Colors .RED5 } /><AreaChart dataSource ={sensorDS } color ={Colors .GREEN5 } /><AreaChart dataSource ={sensorDS } color ={Colors .BLUE5 } /><AreaChart dataSource ={sensorDS } color ="#0066cc" />Color Accessor
For finer color control, use accessor syntax to return a string, hex value or threejs Color.
This can be used for aesthetic styling, to highlight values of interest, or integrate another dimension of sensor data into the AreaChart.
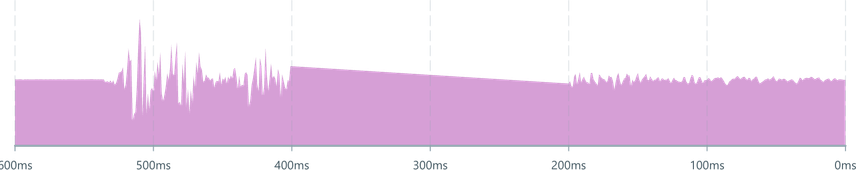
By default, the shaded region will fade between changes in colour. Use the disableColorFading prop to render sharp transitions in color.
<AreaChart dataSource ={sensorDS } color ={0xffffff} disableColorFading colorAccessor ={(data , time ) => { col .setHSL (0.4, 0.6, 0.5) if (time > 450 && time < 500) { col .setHSL (0.0, 0.5, 0.5) } return col .getHex () }}/>Opacity
The global opacity is controlled with the opacity prop using a number between 0.0 and 1.0. By default the opacity is set to 1.
<AreaChart dataSource ={sensorDS } color ={Colors .RED5 } opacity ={0.2} />AlphaAccessor
The opacity can be controlled with accessor syntax to realise complex shading behaviours.
A simple use-case is fading the shaded region for aesthetic control. A LineChart is also rendered to distinguish the data's boundary from the gradient.
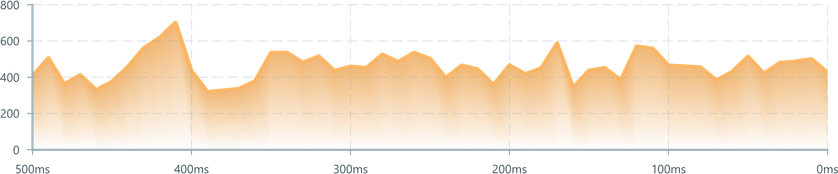
<AreaChart dataSource ={sensorDS } color ={Colors .ORANGE4 } opacity ={0.7} alphaAccessor ={() => [0, 1]} /><LineChart dataSource ={sensorDS } color ={Colors .ORANGE5 } lineWidth ={4} />For data which crosses the y-axis, the alpha behaviour needs to be flipped.
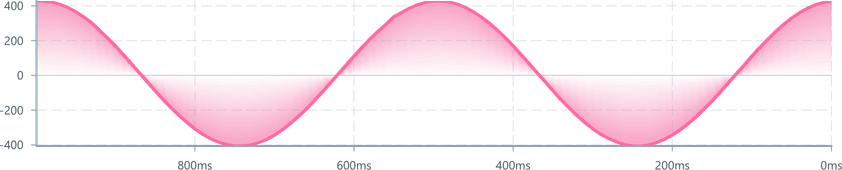
<AreaChart dataSource ={transformed } color ={Colors .ROSE4 } opacity ={0.5} alphaAccessor ={data => { // Fade toward the origin if (data < 0) { return [1, 0] } else { return [0, 1] } }}/><LineChart dataSource ={transformed } color ={Colors .ROSE5 } lineWidth ={4} />Continuity
When connection is lost with a device and regained, most charting solutions span the gap, leading to a a misleading presentation of the data.
By default, connection acceptability (a DataSource of type boolean) is used to punch gaps in the AreaChart. This is a more accurate representation of the data.
To manually control continuity behaviour, the continuitySource prop accepts a Datasource of boolean type where a true describes a break in continuity, and false describes a return to continuity.
A 'hole' will be inserted at the time of the break, and no data will be drawn until continuity is restored.
By default, the continuity source is derived from the device's acceptability, a metric which lags slightly behind the ability for data to come in. Note that data received during this 'potentially unstable connection' state will not be drawn.
<AreaChart dataSource ={sensorDS } continuitySource ={sensorInvalidDS }/>To opt-out of default continuity behaviour, pass null
<LineChart dataSource ={sensorDS } continuitySource ={null}/>continuityAccessor allows typical accessor syntax to use members of a structure as the flag.
Blanking
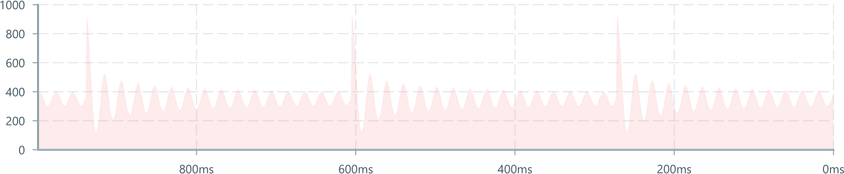
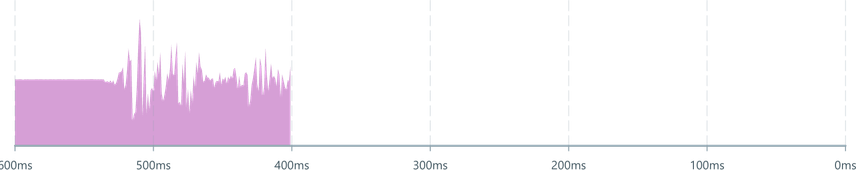
The blankingTrigger property accepts a DataSource. Any Event on this DataSource will wipe the internal store of data, resulting in a blank/empty line.
This can be used clear previous results in longer running test-bench usecases, or can be rapidly invoked to provide oscilloscope style redraw behaviour.
Accessor usage is not currenty supported.
Geometry Cache size
The AreaChart component uses a statically declared internal buffer for geometry storage.
By default, this is internally managed, but can be overridden with the maxItems property to increase/reduce the potential RAM impact of the chart.
This is helpful when you know the incoming data stream is slow, only covers a short timespan, or if high bandwith data is being plotted (>10kps, >1M points).
Electric UI will internally allocate the internal ping-pong geometry buffers as deemed optimal for performance.
As such, the actual value may be some multiple of
4096entries.
<AreaChart dataSource ={analogDataSource } maxItems ={6000} />If
maxItemsisn't big enough to buffer for the selectedRealTimeDomain, then users will see data dropping off the end of the line.