Decimation & Dataflow
Released on 2021-09-30
We've finished a massive rework to improve data-pipelines operation, usability of datasource transformers, and made sweeping improvements to the realtime charting capabilities.
These changes increase performance for all users, raise the performance ceiling for demanding applications, and add some fun new features.
New Features
High-Perf data pipeline
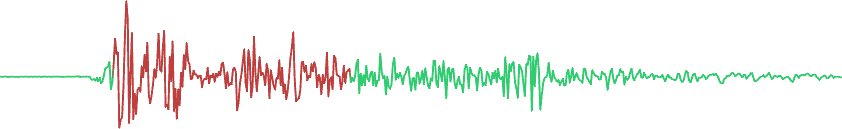
Aside from substantial performance improvements, the charting backend opens up more flexible data processing possibilities.
One fun example is running realtime FFT to show the frequency components of an inbound streaming signal, along with an inverse-FFT to represent a filtered underlying waveform.
Pre-made performance optimised operators are covered in this guide with several real-time filtering examples
DataSource Persistence
In-memory persistence support allows for more capable mathematical transformations of data
All data handled in the background will be drawn when a graph is rendered. Previously a DataSource would have to be active in the renderable context, with the chart(s) connected with RollingStorage requests.
Decimation
Using the decimator dataflow can reduce the graphical load of long-running or high-density datasets.
This can be used to provide more consistent rendering behaviour across low-end devices, or handle millions of points at high frame rates on recent (integrated GPU) laptop class devices.
A basic decimator is described in the DataSource guide
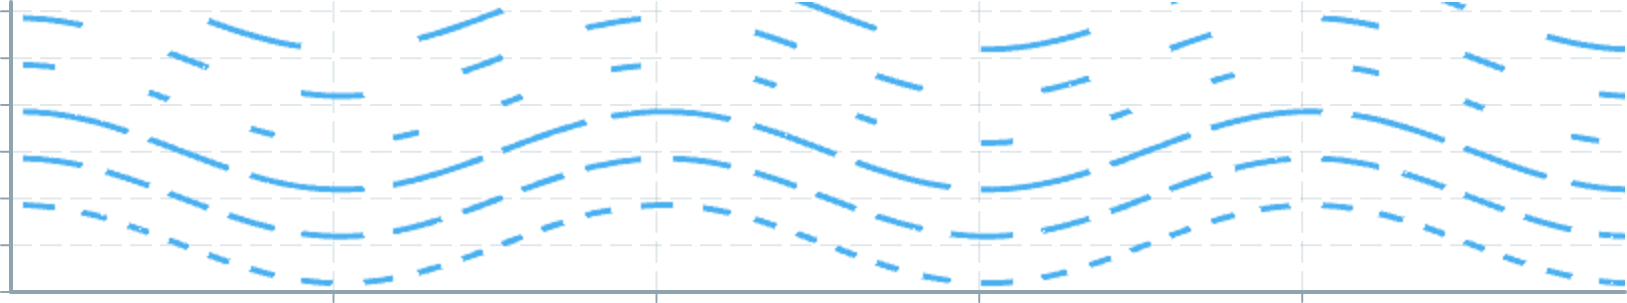
Zoomable Graphs
Allow users to interactively paint a selection for review, while data continues to stream in.
In this example, both LineChart instances use common window values and the default decimation implementation.
Bar Charts
Better representation of bucket-style data.
See the BarChart component docs for details.
Dashed LineChart options
Dashed lines are now available with LineChart by enabling the dashed boolean property. The gap, size and offset are configurable.
See the docs for detail.
Vertex Coloured Lines
Control the colour of sections of LineChart entities. This can be helpful to highlight problem areas or indicate state-changes.
See the docs for detail.
Improvements
Internal Library Improvements
Sweeping refactors have increased unit-test coverage, integration-test coverage, and performance benchmark coverage. This has resulted in dozens of fixes and clarifications of edge-case behaviour.
Increased usage of CancellationTokens and improvements to the transport-to-render IPC improve stability and consistency in edge-cases.
Refactor of binary codecs improved performance by 30% when encoding and >240% when decoding.
IntervalRequester more gracefully handles situations where no device is available, or when connection is re-established.
Multiple requests for the same messageID's are now debounced more intelligently to satisfy the fastest requested rate only.
Bug fixes and improvements to transport Metadata reporters. Added timestamping of metadata information.
Fixed hysteresis with connection acceptability edge-cases.
Template Improvements
Scrollbars now respect DarkMode.
LineChart can now render gaps/holes in the data (amongst the other changes listed above).
VerticalAxis axis drawing edge-case was fixed where the axis tick and horizontal dashed line at y=0 was sometimes not rendered.
Typescript, Electron 13, Yarn v3, and other dependencies have been updated.
Default build formats for macOS and Linux have been changed (.dmg and .AppImage respectively).
Logger components PolledCSVLogger and EventCSVLogger now use the new DataSource API.
CI/CD Migration
We've internally changed our CI/CD tooling and strategy (from GoCD to ConcourseCI, along with new build hardware) as part of a rework of our development and release processes.
The driving goal has been for smaller, more frequent releases - we have often batched months of work into larger releases due to the overhead of managing user-facing release streams.
The newer system overhauls and greatly improves our cross-platform integration testing, end-to-end tests, production smoke-tests, and general builds.
Made possible by the CI/CD infrastructure changes, electricui.com should maintain a faster release cadence and comes with some nice internal tooling to ensure our documentation and examples don't go stale!
Website Update
The releases section (you're reading it now) has been reworked to better suit the newer release approach. Previous releases documentation has been back-ported to the new format.
Shiki TwoSlash ensures our code-snippets are syntax-highlighted correctly, and all snippets and examples in the docs are now checked for correctness.
Documentation layout changes aim to improve navigation speed and readability. Over time we hope to further rework specific weaknesses in our documentation surface.
Errata
2022-03-13 DataFlow improvements
New window operators are available for DataFlows: min, max, mean, and sum. These calculate their respective quantity in regards to a window of time across a DataFlow.
The new DataSourcePrinter component allows for printing direct from a DataSource.
2022-03-16 Bug Fixes & minor improvements
- Hot module reload performance has been improved with an upgrade to Webpack 5, fixing a regression in the previous release.
- MessageDataSources now ignore internal messages such as heartbeats.
- The discovery process is cancelled when a device is disconnected by the user.
- The serial transport now takes an exclusive lock on serial ports
- Fixed unavailability hints not removing connections from devices
- The interval requester is now more tolerant of missed packets.
- DeveloperState type inference has been improved.