Chart Signals and Settings
Released on 2023-07-28
This update is primarily focused around charts and DataFlow.
The majority of Queryables that are interacted with are streams. Sensor data and other values from hardware are timestamped, and their value matters over time. While the values can be decimated as an optimisation, if you zoom in on the data, you expect to see more detail revealed. Values can't be skipped as an optimisation, each value matters.
There's another type of data, called a signal. Individual signal values don't really matter over time, only the latest value matters. Intermediate values can be skipped as an optimisation.
This update brings Signal data types to the UI side of Electric UI. They are useful for interacting with DataFlows and charts to produce settings that can be changed.
The DataTransformer constructor now has an object passed to its closure constructor that contains a watch method. This method synchronously reads a signal, and subscribes to it. Any changes to that signal will cause the query to invalidate, and rerun with the new data.
const [smoothing , setSmoothing ] = useSignalProvider (1) const smoothedSignal = useDataTransformer ( watch => { // Capture and watch the value of the smoothing signal const smoothingFactor = watch (smoothing ) return leakyIntegrator (dataSource , smoothingFactor , 0)})You can build complex user interfaces with many filtering stages and steps, all performantly controlled with this new primative.
Mouse Hover
The mouse position is a great example of a Signal, as you only care about the most recent value.
We added some new hooks and capture components to work with interactions, search based DataFlow operators for temporal and spatial search. When put together, you end up with a powerful mouse based annotation system!
Mouse hover can interact with multiple charts, highlight data, and then drive filtering behaviour with other charts.
This is all powered by the same, unified DataFlow system, allowing reuse of logic across any components, and it all works with strong type safety and great runtime performance.
We've added a new guide walking through adding user-interactible behaviours and annotations.
LineChart step modes
The LineChart now supports a step property, which can be either unset for the default linear interpolation, before, middle or after.
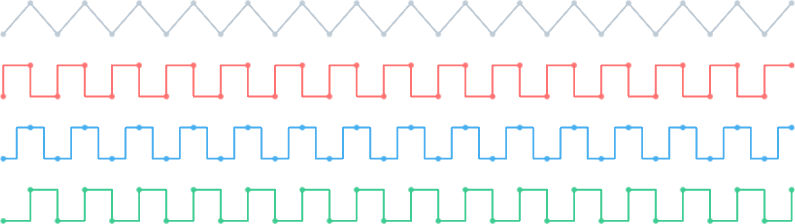
Chart rendering order
Chart rendering order is now strictly defined by the ordering of the components in the ChartContainer.
Here the ScatterPlot is defined after the LineChart.

Here the ScatterPlot is defined before the LineChart.

Opacity Signals for all charts
All chart types now support a global opacity signal prop (opacitySource), intended for mouse-over style highlighting driven by a Legend.
Charts now support a visibility signal that keeps the underlying data pipeline active, again intended for use with a Legend (using the visibilitySource prop).
Legend component
A useLegend hook and Blueprint styled component called Legend provide both hover 'dimming' of charts, and toggleable visibility. The legend supports interactions across different charts.
New DataFlow operators
andandorbinary operators, intended for complex visibility calculations.- A suite of statistics operators including
product,mode,quantile,quantiles,interquartileRange,median,variance,sampleVariance,standardDeviation,sampleStandardDeviation,medianAbsoluteDeviation,harmonicMean,geometricMean,rootMeanSquare.
Continuity
- Continuity ingestion now happens before data ingestion, so continuity events can be inserted to break the line chart just before the data is processed, allowing for...
- Two new dataflow operators,
deltaThresholdContinuityBreakeranddeltaTimeContinuityBreakerwhich insert a break in continuity after a numerical delta threshold is reached, or after a certain amount of time has passed between events. - Overflow information from the embedded side can now be used to insert breaks in continuity as a point is ingested.
Annotations
The new PointAnnotation component provides a colour/size controllable 'dot' to be rendered on Charts with similar syntax to other annotations.
The ElementAnnotation component has been renamed to better fit its usage.
Coalesce improvements
The coalesce DataFlow operator now has a synchronize argument.
By default it is set to false. The operator will wait until all upstream Queryables have emitted at least one event, then will emit an update per upstream event. If the timestamps of the upstream events are exactly the same, only a single update will be emitted per timestamp.
When dealing with real world data however, these updates often come in slightly out of sync. Below is an example of a coalesce operator merging x and y information from separate Queryables, slightly out of time with each other.
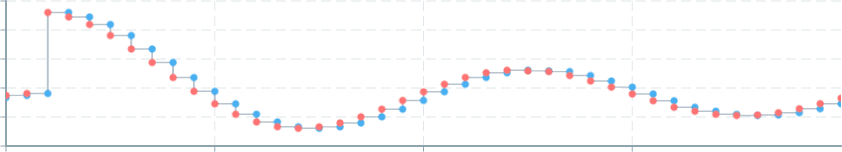
Each blue dot represents an update to the x queryable, each red dot represents an update to the y queryable. The result is this unintended stair-stepped behaviour.
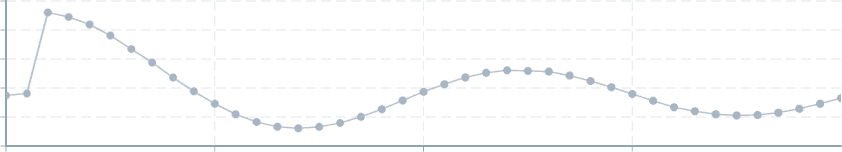
By enabling the synchronize argument, the coalesce operator waits until each 'slot' has received a new event before emitting an update.
When merging Queryables that emit data at different rates, or when merging sparsely updating Queryables with regularly updating Queryables, don't enable the synchronize argument. When merging Queryables that emit data at the same rate, enable the synchronize argument.
ScatterPlot
- Added
blankTriggerproperty toScatterPlotfor consistency with other types of Charting.
General fixes and changes
Several bugs have been fixed:
- ElementAnnotations no longer flicker when visibility is toggled.
- ScatterPlots now draw exactly the correct amount of vertices, previously they drew more 'old buffers' than necessary. This issue was never visible due to the camera frustum culling.
- Statistics in some configurations would not receive the precision property.
- Domains would sometimes not reset after a React re-render, resulting in a blank chart.
- Manually cancelling messages earlier than the deliverability manager's deadline now throws the correct CancellationToken.
- Fixed some builds on Linux.
- Fixed ScatterPlots not drawing their last point. (ScatterPlots will now appear like they have one frame less latency)
As well as some miscellaneous improvements:
- LineChart rendering is now done in two passes to prevent miters rendering strange transparancy artifacts.
- The leaky integrator provided transformer now has a default prefetch value of 0, reducing the number of required arguments.
- The
@electricui/components-desktop-blueprint-loggersentrypoint has been moved to@electricui/components-desktop-blueprint-timeseriesas it now contains more than just loggers.- The old entry point will continue functioning as a redirect, but it's recommended that you switch over.
- The DataSourcePrinter component now supports a
classNameprop to pass through a class name to thespanelement, as well as abackgroundColorAccessorprop to performantly change the background color based on event data. - BlankTriggers can be of any type, the event existance is used in order to blank, not the data type.
- Clicking the disconnect button in the template header now takes the user to the connections page immediately, rather than waiting for the connection acceptability modal.
- Binary protocol heartbeats now use average absolute deviation from the mean as the jitter metric instead of standard deviation.
- The
useDataTransformerhook has been added to memoise DataTransformers created in the React lifecycle. This is now the preferred way of building them. - The
closestSpatiallyoperator can now bail early from a search if thesearchSourceAccessorreturnsnullfrom a particular event from the search Queryable. - LineCharts and TimeSlicedLineCharts can insert a hole on a
nullvalue passed from the accessor. - The EventLogger component and hook are now generic over their DataSources providing type checking and hinting.
- ScatterPlot supports an alpha accessor for per sprite alpha.
- ScatterPlot can accept multiple points per event, similarly the other accessors can provide a single value or an array that matches up.
- The
sortedDimensionprop has been removed from charts that can do multiple orientations (such as ScatterPlots). The domain now has asortedDimensionprop to replace it. - The
BarChartDomainwill now grab window and zoom information as if it's an annotation, automatically matching other charts in the ZoomContext. If it should not, wrap it in its ownZoomWrapper.
Update instructions
An automatic upgrade is available by running the following command in your template directory:
arc upgrade --template [email protected]
Please replace any imports from @electricui/components-desktop-blueprint-loggers with @electricui/components-desktop-blueprint-timeseries. Unfortunately our migration tooling can't do this automatically at the moment.
Replace any previous usage of PointAnnotation with ElementAnnotation.
Feel free to contact support if you need any help upgrading.